








Ethereum
October 12, 2026
Ethereum Price Eyes $5,000 as Linked Wallets Send $11M to Kraken

Ethereum price losses ran deeper than Bitcoin’s as traders absorbed the latest US CPI release, but the gap went beyond their percentage declines. Forced closures of leveraged positions hit Ether harder, while withdrawals from its exchange-traded funds added another sign of weak demand. For investors comparing Ethereum vs Bitcoin, the question is why ETH proved more vulnerable. One clue lies in positioning that looked smaller in dollar terms before the selloff, yet barely changed in coins.
Also Read: Apple Stock Tops $5T as China AI Rollout Targets December, and OpenAI Makes Court Pledge
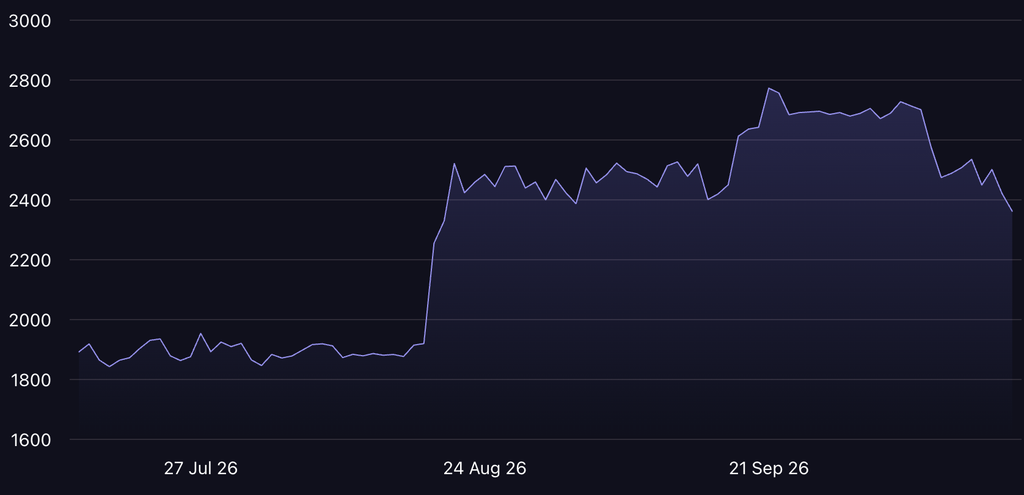
A recent post recorded Ethereum down 5.31% to $2,373.87 over 24 hours. Bitcoin price losses reached 2.54%, leaving BTC at $81,328 in the same report. These figures capture the selloff surrounding the inflation release rather than a precise release-to-publication return.
The difference was also apparent in derivatives. Ethereum recorded $283.1 million in liquidations, versus $196 million for Bitcoin. More than $261 million of ETH’s total came from long positions, meaning bullish traders absorbed most of the damage.
Across the market, crypto liquidations reached $942.1 million, with longs accounting for 91.6%. Ethereum’s liquidation bill exceeded Bitcoin’s by $87.1 million despite its smaller market capitalization.
Also Read: SEC Clears New Prediction Contracts as Quorum Rule Opens Door to Crypto Decisions
Santiment highlighted a detail easily missed in dollar-denominated charts. Ethereum’s open interest and price both fell approximately 11% between October 4 and October 14.
Measured in ETH, however, open interest stood at approximately 6.23 million coins on both dates. The dollar decline therefore did not, by itself, establish that traders had reduced their outstanding exposure. Falling prices had lowered the dollar value of those positions.
Ethereum ETF outflows were another measure of pressure. Farside Investors recorded $129.5 million leaving US Ether funds on October 14, reversing the previous session’s $24.8 million inflow. ETF flows and liquidations measure different activity, but both showed strain around the selloff.

MarketCapOf’s comparison tool shows the size difference. It valued Ethereum at approximately $288.47 billion, against Bitcoin’s $1.63 trillion.
Using those figures and holding Ethereum’s circulating supply constant, ETH would trade at approximately $13,326.67 if it matched Bitcoin’s market capitalization. This is 5.64 times the tool’s $2,361.79 ETH reference price, equivalent to roughly 464% upside.
This is a hypothetical valuation comparison, not a price forecast. The tool’s separate $13.33 million estimate represents the value of 1,000 ETH under that scenario, rather than a $1,000 investment.
The comparison gives the liquidation figures useful scale: Ethereum absorbed more forced closures even though its market value was only about 18% of Bitcoin’s.
Also Read: Musk Eyes $100T SpaceX Barring Major World War as $800 Stock Target & Tesla Merger Talk Build

Written by Sahana Kiran
Sahana Kiran has been covering financial markets since 2019, with a focus on cryptocurrencies, fintech, and the geopolitical events shaping them. She previously reported for AmbCrypto and Watcher Guru, and now writes for MarketCapOf.