






Stocks
October 24, 2026
Amazon CEO Says 2027 AWS Capacity Largely Booked as BofA Keeps Microsoft’s $600 Target
Apple (AAPL) stock briefly reclaimed the world’s highest market valuation Friday, just as its most expensive iPhone reached stores. The timing gave investors another reason to watch the company’s push into premium devices, with Nvidia stock moving in the opposite direction over October. But the celebration comes with a warning from the weekly chart. After Apple’s latest run higher, one closely followed technical analyst is questioning how much room the rally has left to run.
Also Read: Amazon CEO Says 2027 AWS Capacity Largely Booked as BofA Keeps Microsoft’s $600 Target
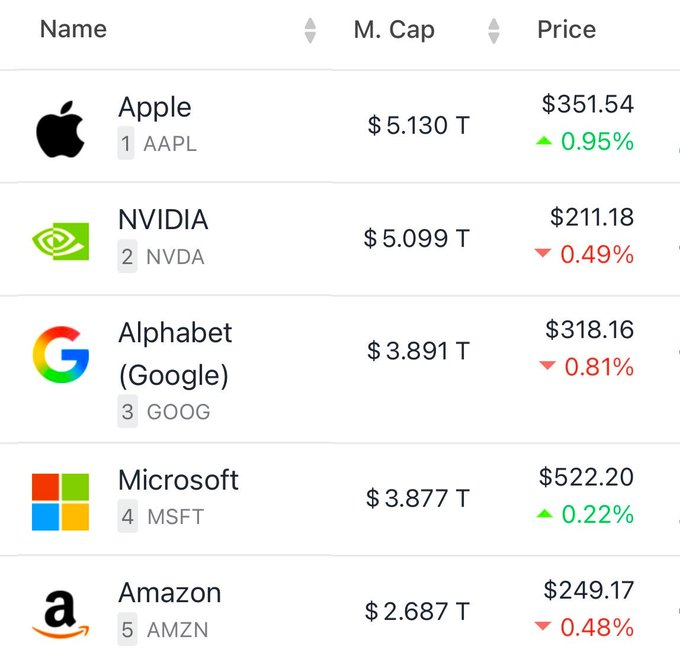
Apple briefly passed Nvidia during October 23 trading, with both companies valued near $5.1 trillion. Reports revealed that the move coincided with the arrival of the iPhone Duo, Apple’s first foldable phone. The temporary lead marks another turn in the contest between the two companies.
The device starts at $1,999, with the highest-storage version priced at $3,199. This gives Apple a higher-priced product to sell, although its contribution to revenue will depend on shipment volumes and which configurations customers choose.
According to Apple’s announcement, the Duo has a 7.6-inch inner display and a 5.4-inch outer screen. Apple unveiled it September 9, opened preorders October 16, and began availability October 23. For shareholders, the commercial question is whether the new design can sustain demand beyond the initial launch.
But Apple’s market cap leadership and product demand tell only part of the stock’s recent story.
Also Read: American Express Stock Slides Despite Profit Beat as 5% Job Cuts Loom
Technical analyst Ali Martinez flagged a TD Sequential sell signal on Apple’s weekly chart. In his analysis, the previous two comparable signals were followed by corrections of 15.66% and 13.63%.
This is a warning about possible exhaustion after a rally. Two historical examples offer limited evidence for predicting the size or timing of another decline, and the signal does not establish that a reversal has begun.
The October return comparison shows why the warning is attracting attention. MarketCapOf’s ROI calculator, using the October 1–24 selection, puts a hypothetical $5,000 Apple investment at $5,255.36, a gain of 5.11%. An equal investment in Nvidia falls to $4,579.83, down 8.40%.
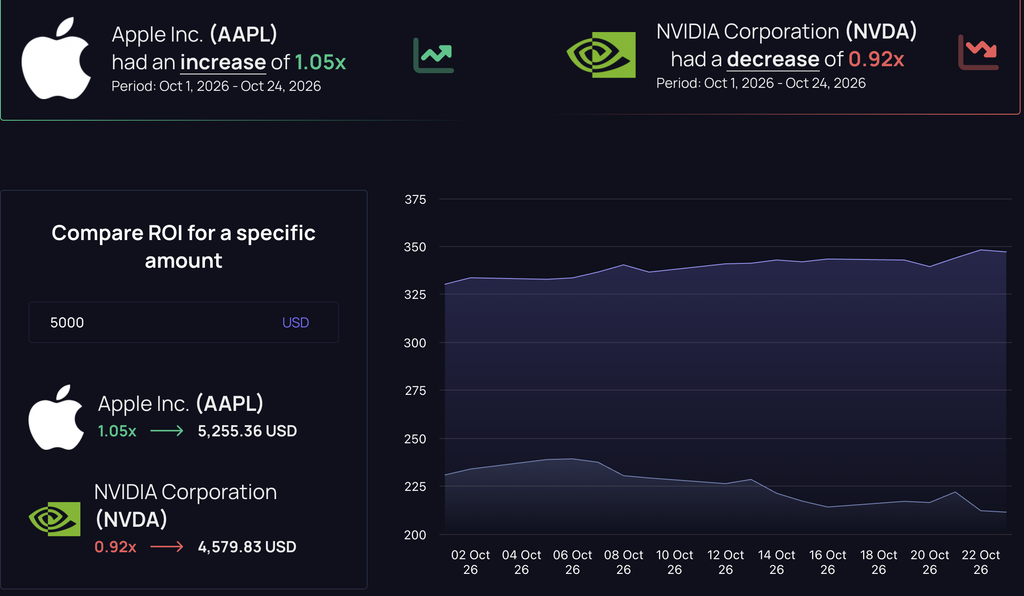
Apple therefore finishes $675.53 ahead over the selected period. The calculator’s 1.05x and 0.92x figures are rounded investment multiples.
Those gains explain Apple’s stronger position heading into the launch. Whether they hold will require more than a brief lead in the valuation rankings.
Also Read: Chainlink Partners With LG CNS in Korea’s $68B Market as LINK Forecast Points to $18.61

Written by Sahana Kiran
Sahana Kiran has been covering financial markets since 2019, with a focus on cryptocurrencies, fintech, and the geopolitical events shaping them. She previously reported for AmbCrypto and Watcher Guru, and now writes for MarketCapOf.