
GATX Corporation
GATX
Rank in Stocks
#3162
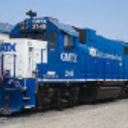
GATX Corporation, established in Chicago, Illinois in 1898, is a prominent... GATX Corporation, established in Chicago, Illinois in 1898, is a prominent global equipment lessor. The company primarily provides railcar and locomotive leasing services across North America and internationally, catering to vital industries such as petroleum, chemicals, food/agriculture, and transportation. Its operational framework is divided into three key segments: Rail North America, Rail International, and Portfolio Management. Beyond simply supplying equipment, GATX offers a comprehensive suite of support and maintenance services for its rail fleet. These include interior cleaning, routine upkeep and repairs to car bodies and safety features, ensuring regulatory compliance, facilitating wheelset replacements, performing interior blasting and lining, exterior painting, and applying car stenciling. Furthermore, GATX's activities extend to leasing aircraft spare engines (including units it directly owns) and managing a small collection of five liquefied gas-carrying vessels. The company also applies its expertise to overseeing asset portfolios on behalf of third parties. GATX maintains a substantial asset base, comprising approximately 147,000 railcars, a combined fleet of 568 locomotives (539 four-axle and 29 six-axle), and its five specialized vessels.
Share Price
$161.61
Market Cap
$5.71B
Change (1 day)
-1.31%
Change (1 year)
-6.57%
Country
US
Trade GATX Corporation (GATX)


Category
Industrials
Number of shares outstanding for GATX Corporation (GATX)
Number of shares outstanding as of June 2026: 35.70M
According to GATX Corporation latest financial reports and stock price the company's current number of shares outstanding is 35.70M. At the end of December 2023 the company had 35.70M shares outstanding. The number of outstanding shares is usually impacted by stock plits and shares buy back.
Shares outstanding history for GATX Corporation (GATX) from 2000 to 2026
Shares Outstanding at the end of each year
| Year | Shares Outstanding | Change |
|---|---|---|
| 2026 (TTM) | 35.70M | -0.28% |
| 2024 | 35.80M | 0.28% |
| 2023 | 35.70M | 0.85% |
| 2022 | 35.40M | 0.00% |
| 2021 | 35.40M | 1.14% |
| 2020 | 35.00M | -1.96% |
| 2019 | 35.70M | -5.05% |
| 2018 | 37.60M | -3.09% |
| 2017 | 38.80M | -4.20% |
| 2016 | 40.50M | -6.03% |
| 2015 | 43.10M | -4.22% |
| 2014 | 45.00M | -3.02% |
| 2013 | 46.40M | -0.85% |
| 2012 | 46.80M | 0.86% |
| 2011 | 46.40M | 0.65% |
| 2010 | 46.10M | -1.50% |
| 2009 | 46.80M | -1.68% |
| 2008 | 47.60M | -4.61% |
| 2007 | 49.90M | -2.16% |
| 2006 | 51.00M | 1.79% |
| 2005 | 50.11M | 1.54% |
| 2004 | 49.35M | 0.54% |
| 2003 | 49.08M | 0.39% |
| 2002 | 48.89M | 0.66% |
| 2001 | 48.57M | 1.36% |
| 2000 | 47.91M | 0.00% |
Shares Outstanding for similar companies or competitors
| Company | Shares Outstanding | Difference | Country |
|---|---|---|---|
| 63.40M | 77.59% |
US
|
|
| - | - |
US
|
|
| 156.06M | 337.15% |
IE
|
|
| - | - |
BR
|
|
| 196.08M | 449.24% |
US
|


