
China Railway Construction Heavy Industry Corporation Limited
688425
Rank in Stocks
#4654
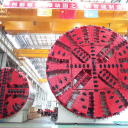
China Railway Construction Heavy Industry Corporation Limited (CRCHI) is a... China Railway Construction Heavy Industry Corporation Limited (CRCHI) is a prominent global manufacturer specializing in equipment for the underground construction and rail transit industries. The company's core product offerings include heavy machinery such as tunnel boring machines (TBMs), shaft-boring machines, drilling jumbos, and concrete sprayers. It also supplies specialized tunnel vehicles for lifting and installation tasks, along with critical rail infrastructure components like railway turnouts, clips, and fasteners. CRCHI further diversifies its product range to encompass New Austrian Tunneling Method (NATM) equipment, comprehensive rail track and maglev systems, various railway transit solutions, agricultural machinery, green building construction tools, coal mine equipment, and general construction materials. Beyond products, the company delivers a full suite of services, including design, fabrication, training, on-site support, equipment refurbishment, and spare parts provision. Established in 2007, CRCHI maintains its headquarters in Changsha, China, operating as a subsidiary under the umbrella of China Railway Construction Corporation Limited.
Share Price
$0.60047469
Market Cap
$3.20B
Change (1 day)
0.50%
Change (1 year)
-25.58%
Country
CN
Trade China Railway Construction Heavy Industry Corporation Limited (688425)


Category
Industrials
Operating Margin for China Railway Construction Heavy Industry Corporation Limited (688425)
Operating Margin as of October 2026 TTM: 14.19%
According to China Railway Construction Heavy Industry Corporation Limited latest financial reports and stock price the company's current Operating Margin (TTM) is 14.19%. At the end of 2024 the company had an Operating Margin of 16.46%.
Operating Margin history for China Railway Construction Heavy Industry Corporation Limited from 2017 to 2026
Operating Margin at the end of each year
| Year | Operating Margin | Change |
|---|---|---|
| 2026 (TTM) | 14.19% | -14.47% |
| 2025 | 16.59% | 0.79% |
| 2024 | 16.46% | -5.40% |
| 2023 | 17.40% | -12.87% |
| 2022 | 19.97% | -1.29% |
| 2021 | 20.23% | -13.06% |
| 2020 | 23.27% | -1.15% |
| 2019 | 23.54% | -1.18% |
| 2018 | 23.82% | 18.80% |
| 2017 | 20.05% | 0.00% |
Operating Margin for similar companies or competitors
| Company | Operating Margin | Operating Margin Difference | Country |
|---|---|---|---|
| 0.00% | - |
US
|
|
| 11.89% | -99.16% |
DE
|
|
| 0.00% | - |
FR
|
|
| 0.00% | - |
DE
|
|
| 21.55% | -98.48% |
US
|


What is a company's Operating Margin?
The operating margin is a key indicator to assess the profitability of a company. Higher operating margins are generaly better as they show that a company is able to sell its products or services for much more than their production costs. The operating margin is calculated by dividing a company's earnings by its revenue.