








Bitcoin
September 24, 2026
Trump Reports New Strategy and Coinbase Buys as Bitcoin Climbs and Whales Keep Accumulating

This month, the Bitcoin rally has accelerated, with BTC making some sharp moves recently. Bitcoin’s price closed above its 50-week moving average for the first time in 45 weeks. While the asset closed the earlier week at $81K, Bitcoin has since then moved to hit $85K, reaching its highest level since January 2026.
Also Read: AAPL Stock Eyes $380 as Apple, Google Hire for Stablecoin, Web3

The Bitcoin price has been encountering extreme volatility lately. The failure of the CLARITY Act and the Fed’s rate hike added pressure to the market, but Bitcoin later recovered. Bitcoin’s price has recovered sharply after falling to the $76K mark. The Bitcoin price has now moved back above its 50-week moving average, showing stronger momentum in the recent recovery.
While this has sparked fresh narratives for Bitcoin, this move alone does not prove whether Bitcoin will bring in a bull market. The Bitcoin rally needs to sustain further with the asset maintaining its 50-week moving average for it to show that the recovery is holding.
A 50-week moving average is a long-term line on a price chart. This line shows the average price of an asset over the past 50 weeks. Traders use it to understand the longer-term price trend.
“Sep 18, the breakout day, gained close to 6%. New addresses that day came in at 1.00x. Active addresses, 1.00x. Social volume ran 1.23x, and transactions above $100k ran 1.18x. Both lifted, neither reached its high for the window. Open interest rose 9% on Sep 18 and has held there since. Aug 21 was also a Friday, and it gained close to 7%. New addresses 1.07x, active addresses 1.14x—the smaller August move reached more wallets than the September breakout did.”
The latest Santiment data sheds more light on the recent Bitcoin rally statistics. The platform shared how the September 18 breakout did not bring any major jump in its network activity. New and active address count remains normal, while transactions worth more than $100,000 were 1.18 times the baseline.
Also Read: Bitcoin Price Hits $85K as Russia Counts 20M Crypto Users, Sberbank Forecasts $46B Trading
The wider crypto market cap has also recovered some of its lost pace. Per the latest post by CoinGecko, the crypto market cap jumped to hit $3T, as broader crypto market momentum continues to recover and heal.
This signals the wider crypto market recovery. Solana and Ethereum have also gained as the broader crypto market has recovered, bringing relief to the wider crypto market.
According to CoinCodex Stats, Bitcoin is predicted to hit a new high of $245K by the year 2030.
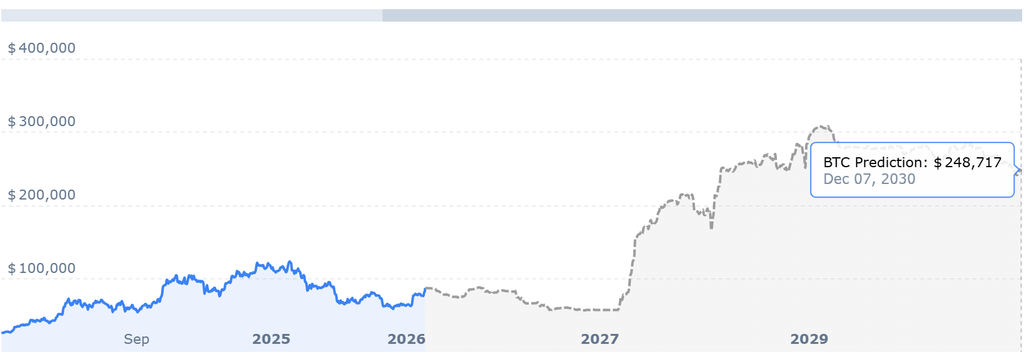
CoinCodex predicts a volatile 2026 for BTC, with the asset undergoing many dips and recovering from it all. The final price that CC adds for 2030 is $245K.
“Bitcoin is forecasted to hit $ 76,250 by the end of 2026 (-10.97% compared to current rates), $ 251,544 by 2030 (+193.71%), $ 1.19M by 2040 (+1,287.43%), and $ 1.41M by 2050 (+1,541.86%).”
However crypto markets are subjected to intense volatilty hence user discretion becomes imperative before making any investment related decisions
Also Read: AI Boom Reshapes US Economy as Tech Investment Tops Housing and AI Jobs Lead Pay Growth

Written by Juhi Mirza
Juhi Mirza is a crypto journalist and writer covering digital assets, blockchain, markets, and emerging trends in the Web3 industry.