
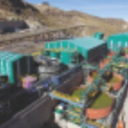
Compañía de Minas Buenaventura S.A.A.
BVN
Rank in Stocks
#2504
Compañía de Minas Buenaventura S.A.A. is a prominent Peruvian mining company... Compañía de Minas Buenaventura S.A.A. is a prominent Peruvian mining company focused on the exploration, development, processing, and commercialization of both precious and base metals. Its primary targets for extraction include gold, silver, lead, zinc, and copper. The company operates several key mining units within Peru, such as Tambomayo (Caylloma province), Orcopampa (Castilla province), Uchucchacua (Oyón province), and Julcani (Angaraes province). It also manages the San Gabriel project in the General Sánchez Cerro province, Moquegua region. Furthermore, Buenaventura holds significant interests in other notable mines, including Colquijirca, La Zanja, Yanacocha, Cerro Verde, El Brocal, Coimolache, Yumpaq, San Gregorio, and the Trapiche mining unit. Diversifying its operations, the company also produces manganese sulphate monohydrate and other mineral by-products, in addition to operating hydroelectric power plants. Established in 1953, Compañía de Minas Buenaventura S.A.A. is headquartered in Lima, Peru.
Share Price
$30.47
Last synced: 2026-10-16
Market Cap
$7.74B
Change (1 day)
-2.21%
Change (1 year)
19.16%
Country
PE
Trade Compañía de Minas Buenaventura S.A.A. (BVN)


Category
Basic Materials
Dividend history for Compañía de Minas Buenaventura S.A.A. (BVN)
Compañía de Minas Buenaventura S.A.A. (stock symbol: BVN) made a total of 51 dividend payments.
The sum of all dividends (adjusted for stock splits) is : $4.58
Dividend yield (TTM) : 0.0372
The sum of all dividends (adjusted for stock splits) is : $4.58
Dividend yield (TTM) : 0.0372
Dividend payments for Compañía de Minas Buenaventura S.A.A. (BVN) from 1996 to 2026
Annual dividend payments
| Year | Dividend (stock split adjusted) | Change |
|---|---|---|
| 2026 (TTM) | $0.1387 | -67.81% |
| 2025 | $0.4309 | 490.27% |
| 2024 | $0.073 | 0.00% |
| 2023 | $0.073 | 0.00% |
| 2022 | $0.073 | -13.61% |
| 2019 | $0.0845 | -2.09% |
| 2018 | $0.0863 | 0.58% |
| 2017 | $0.0858 | 195.86% |
| 2016 | $0.029 | -14.71% |
| 2014 | $0.034 | -88.67% |
| 2013 | $0.3 | -47.37% |
| 2012 | $0.57 | 1.79% |
| 2011 | $0.56 | 21.74% |
| 2010 | $0.46 | 187.50% |
| 2009 | $0.16 | -20.00% |
| 2008 | $0.2 | -27.27% |
| 2007 | $0.275 | 17.02% |
| 2006 | $0.235 | 30.56% |
| 2005 | $0.18 | 12.50% |
| 2004 | $0.16 | -27.11% |
| 2003 | $0.2195 | 181.41% |
| 2002 | $0.078 | 49.14% |
| 2001 | $0.0523 | 33.76% |
| 2000 | $0.0391 | 3.99% |
| 1999 | $0.0376 | 15.69% |
| 1998 | $0.0325 | -15.58% |
| 1997 | $0.0385 | 148.39% |
| 1996 | $0.0155 | 0.00% |
List of all dividend payments
| Year | Dividend | Change |
|---|---|---|
| 2026 (TTM) | $0.1387 | -67.81% |
| 2025 | $0.4309 | 490.27% |
| 2024 | $0.073 | 0.00% |
| 2023 | $0.073 | 4.29% |
| 2022 | $0.07 | -19.54% |
| 2019 | $0.087 | -3.33% |
| 2018 | $0.09 | 3.45% |
| 2017 | $0.087 | 190.00% |
| 2016 | $0.03 | -11.76% |
| 2014 | $0.034 | -89.03% |
| 2013 | $0.31 | -48.33% |
| 2012 | $0.6 | 7.14% |
| 2011 | $0.56 | 25.17% |
| 2010 | $0.4474 | 190.33% |
| 2009 | $0.1541 | -49.69% |
| 2008 | $0.3063 | -44.31% |
| 2007 | $0.55 | 17.02% |
| 2006 | $0.47 | 30.56% |
| 2005 | $0.36 | 14.87% |
| 2004 | $0.3134 | -53.97% |
| 2003 | $0.6808 | 118.21% |
| 2002 | $0.312 | 49.28% |
| 2001 | $0.209 | 33.97% |
| 2000 | $0.156 | 3.45% |
| 1999 | $0.1508 | 22.50% |
| 1998 | $0.1231 | -20.06% |
| 1997 | $0.154 | 148.39% |
| 1996 | $0.062 | 0.00% |
Dividend payments for similar companies or competitors
| Company | Number of dividend payments | Country |
|---|---|---|
| 0.00% |
RU
|
|
| 32.00% |
MX
|
|
| 0.00% |
SE
|
|
| 0.00% |
ID
|
|
| 0.00% |
CA
|


