


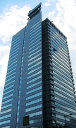
Tohoku Electric Power Company, Incorporated
9506
Hisse Senetlerindeki Sıralama
#3958
Tohoku Electric Power Co., Inc. operates as a comprehensive energy enterprise,... Tohoku Electric Power Co., Inc. operates as a comprehensive energy enterprise, providing services both within Japan and globally. Its operations are compartmentalized into three primary areas: electricity generation and retail, power grid management and distribution, and infrastructure development. The firm generates and supplies power through a variety of methods, including hydroelectric, thermal, nuclear, internal combustion, and sustainable energy sources. Additionally, the company's activities extend to the construction of electrical and telecommunication infrastructure as well as buildings, civil engineering endeavors, the creation and production of electricity supply apparatus, and research, assessment, and consultancy services pertaining to environmental conservation. Founded in 1951, Tohoku Electric Power Co., Inc. is headquartered in Sendai, Japan.
Hisse Fiyatı
$8.24
Piyasa Değeri
$4.12B
Değişim (1 gün)
-0.16%
Değişim (1 yıl)
17.92%
Ülke
JP
Ticaret Tohoku Electric Power Company, Incorporated (9506)


Kategori
Utilities
Tohoku Electric Power Company, Incorporated (9506) için Faaliyet Marjı
October 2026 itibarıyla Faaliyet Marjı TTM: 5.95%
Tohoku Electric Power Company, Incorporated şirketinin en son finansal raporlarına ve hisse fiyatına göre, mevcut faaliyet marjı (TTM) 5.95%'dir. 2024 yılı sonunda şirketin faaliyet marjı 11.44% idi.
Tohoku Electric Power Company, Incorporated için 2005 ile 2026 arasındaki Faaliyet Marjı geçmişi
Her yıl sonunda Faaliyet Marjı
| Yıl | Faaliyet Marjı | Değiştir |
|---|---|---|
| 2026 (TTM) | 5.95% | -43.87% |
| 2025 | 10.60% | -7.34% |
| 2024 | 11.44% | -291.30% |
| 2023 | -5.98% | 336.50% |
| 2022 | -1.37% | -135.68% |
| 2021 | 3.84% | -25.87% |
| 2020 | 5.18% | 37.04% |
| 2019 | 3.78% | -26.46% |
| 2018 | 5.14% | -23.17% |
| 2017 | 6.69% | -26.16% |
| 2016 | 9.06% | 16.45% |
| 2015 | 7.78% | 85.24% |
| 2014 | 4.20% | -234.62% |
| 2013 | -3.12% | -62.99% |
| 2012 | -8.43% | -225.63% |
| 2011 | 6.71% | 24.95% |
| 2010 | 5.37% | -6,812.50% |
| 2009 | -0.08% | -101.79% |
| 2008 | 4.46% | -42.45% |
| 2007 | 7.75% | 28.95% |
| 2006 | 6.01% | -40.90% |
| 2005 | 10.17% | 0.00% |
Benzer şirketler veya rakipler için Faaliyet Marjı
| Şirket | Faaliyet Marjı | Faaliyet Marjı Farkı | Ülke |
|---|---|---|---|
| 29.49% | -95.04% |
US
|
|
| 24.19% | -95.93% |
US
|
|
| 0.00% | - |
US
|
|
| 28.36% | -95.23% |
US
|
|
| 25.13% | -95.78% |
US
|


Bir şirketin Faaliyet Marjı'ı nedir?
Faaliyet Marjı, bir şirketin kârlılığını değerlendirmek için temel bir göstergedir. Daha yüksek Faaliyet Marjı değerleri genellikle daha iyidir çünkü bir şirketin ürün veya hizmetlerini üretim maliyetlerinden çok daha yüksek bir fiyata satabildiğini gösterir. Faaliyet Marjı, şirketin kârının gelirine bölünmesiyle hesaplanır.