


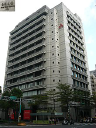
TCC Group Holdings Co Ltd.
1101
Hisse Senetlerindeki Sıralama
#2867
Taiwan Cement Corporation, operating as TCC Group Holdings Co Ltd., is a... Taiwan Cement Corporation, operating as TCC Group Holdings Co Ltd., is a diverse Taiwanese conglomerate established in 1946 and based in Taipei. Its primary business involves the manufacturing and distribution of cement, associated products, and ready-mix concrete within Taiwan, alongside international exports of cement and cement clinkers. The company's operations span various divisions, including Cement, Chemical Engineering, Electricity, and a broad 'Other' category. TCC also plays a role in the energy sector, producing both thermal and renewable power. Beyond its core offerings, TCC processes and vends a wide array of materials, such as refractory, chemical, and rubber raw materials, batteries, and limestone. Its extensive service portfolio encompasses property rentals, energy technology development, information software design, afforestation projects, industrial port administration, maritime transport, engineering, construction and leasing, waste management (including hazardous waste), business advisory services, port facilities, software and equipment maintenance, and comprehensive logistics and transportation solutions. Additionally, the company is involved in sand and gravel processing and sales, international trade, warehousing, mining operations, and the production and commercialization of slag powder.
Hisse Fiyatı
$0.86334361
Piyasa Değeri
$6.47B
Değişim (1 gün)
-0.55%
Değişim (1 yıl)
13.28%
Ülke
TW
Ticaret TCC Group Holdings Co Ltd. (1101)


Kategori
Basic Materials
TCC Group Holdings Co Ltd. (1101) için Faaliyet Marjı
October 2026 itibarıyla Faaliyet Marjı TTM: 7.85%
TCC Group Holdings Co Ltd. şirketinin en son finansal raporlarına ve hisse fiyatına göre, mevcut faaliyet marjı (TTM) 7.85%'dir. 2023 yılı sonunda şirketin faaliyet marjı 9.18% idi.
TCC Group Holdings Co Ltd. için 2006 ile 2026 arasındaki Faaliyet Marjı geçmişi
Her yıl sonunda Faaliyet Marjı
| Yıl | Faaliyet Marjı | Değiştir |
|---|---|---|
| 2026 (TTM) | 7.85% | -29.15% |
| 2024 | 11.08% | 20.70% |
| 2023 | 9.18% | 3.15% |
| 2022 | 8.90% | -65.25% |
| 2021 | 25.61% | -21.99% |
| 2020 | 32.83% | 12.70% |
| 2019 | 29.13% | 28.78% |
| 2018 | 22.62% | 59.30% |
| 2017 | 14.20% | -2.41% |
| 2016 | 14.55% | 40.85% |
| 2015 | 10.33% | -38.44% |
| 2014 | 16.78% | 9.60% |
| 2013 | 15.31% | 39.95% |
| 2012 | 10.94% | -19.85% |
| 2011 | 13.65% | -7.39% |
| 2010 | 14.74% | 2.57% |
| 2009 | 14.37% | 116.42% |
| 2008 | 6.64% | -60.52% |
| 2007 | 16.82% | 8.87% |
| 2006 | 15.45% | 0.00% |
Benzer şirketler veya rakipler için Faaliyet Marjı
| Şirket | Faaliyet Marjı | Faaliyet Marjı Farkı | Ülke |
|---|---|---|---|
| 0.00% | - |
PH
|
|
| 13.90% | -98.23% |
IE
|
|
| 0.00% | - |
CH
|
|
| 0.00% | - |
FR
|
|
| 14.03% | -98.21% |
IN
|


Bir şirketin Faaliyet Marjı'ı nedir?
Faaliyet Marjı, bir şirketin kârlılığını değerlendirmek için temel bir göstergedir. Daha yüksek Faaliyet Marjı değerleri genellikle daha iyidir çünkü bir şirketin ürün veya hizmetlerini üretim maliyetlerinden çok daha yüksek bir fiyata satabildiğini gösterir. Faaliyet Marjı, şirketin kârının gelirine bölünmesiyle hesaplanır.