


HMM Co.,Ltd
011200
Hisse Senetlerindeki Sıralama
#1452
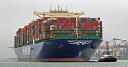
As a global, integrated logistics provider, HMM Co.,Ltd delivers comprehensive... As a global, integrated logistics provider, HMM Co.,Ltd delivers comprehensive shipping and freight forwarding solutions worldwide. The company facilitates the transport of a broad spectrum of goods, from vital bulk commodities like crude oil, coal, and iron ore, to specialized cargo and general import/export consignments. Its diverse fleet includes container ships, bulk carriers, various tankers (for crude oil and refined products), and trampers of different classes, such as Cape, Panamax, Supramax, and Handy vessels, alongside specialized heavy-lift and custom product carriers. Established in 1976, the company, originally known as Hyundai Merchant Marine Co.,Ltd, rebranded to HMM Co.,Ltd in March 2020. Its headquarters are situated in Seoul, South Korea.
Hisse Fiyatı
$16.15
Piyasa Değeri
$15.23B
Değişim (1 gün)
-0.43%
Değişim (1 yıl)
14.44%
Ülke
KR
Ticaret HMM Co.,Ltd (011200)


Kategori
Industrials
HMM Co.,Ltd (011200) için kazanç
Jun 2026 itibarıyla kazanç TTM: $1.07B
HMM Co.,Ltd şirketinin en son finansal raporlarına göre, mevcut kazancı $1.07B'dir. 2023 yılında şirket $814.40M kazanç elde etti, bu 2022 yılındaki $8.07B kazanca göre önceki yıla göre azalma. Bu sayfada gösterilen kazanç, faiz ve vergiler öncesi kazançtır; yani EBIT.
HMM Co.,Ltd için kazanç geçmişi 2007 - 2026
Her yılın sonundaki kazanç
| Yıl | Kazanç | Değiştir |
|---|---|---|
| 2026 (TTM) | $1.07B | -59.51% |
| 2024 | $2.65B | 225.44% |
| 2023 | $814.40M | -89.91% |
| 2022 | $8.07B | 80.10% |
| 2021 | $4.48B | 3,706.68% |
| 2020 | $117.71M | -123.17% |
| 2019 | $-508.09M | -27.36% |
| 2018 | $-699.50M | -37.20% |
| 2017 | $-1.11B | 223.24% |
| 2016 | $-344.56M | -40.82% |
| 2015 | $-582.24M | 36.98% |
| 2014 | $-425.05M | -35.10% |
| 2013 | $-654.96M | -28.07% |
| 2012 | $-910.56M | 106.88% |
| 2011 | $-440.15M | -243.02% |
| 2010 | $307.75M | -143.07% |
| 2009 | $-714.52M | -253.73% |
| 2008 | $464.79M | 96.74% |
| 2007 | $236.24M | 0.00% |
Benzer şirketler veya rakipler için kazanç
| Şirket | Kazanç | Kazanç Farkı | Ülke |
|---|---|---|---|
| - | - |
KR
|
|
| - | - |
DK
|
|
| $1.69B | 57.41% |
IN
|
|
| - | - |
CN
|
|
| - | - |
DE
|


