


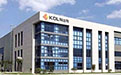
Shenzhen Kedali Industry Co., Ltd.
002850
Hisse Senetlerindeki Sıralama
#2923
Shenzhen Kedali Industry Co., Ltd., together with its subsidiaries, engages in... Shenzhen Kedali Industry Co., Ltd., together with its subsidiaries, engages in the research, development, manufacture, and sale of precision battery structural components and automotive structural components parts in China and internationally. It offers prismatic can, mobile battery aluminum and cylindrical can, mobile battery prismatic can, power battery, precision structural part of lithium-ion battery, aluminum terminal, Cu-Al compound terminal, cylindrical explosion-proof lithium battery lid/cover/cap, busbar, copper busbar, and mobile batter prismatic can, as well as cylindrical collector, prismatic, and mobile lid/cover/cap. The company also provides auto parts, auto seats, armature, automotive central control instrument, EPB electric motor assembly, and auto door handle; and Cu-Al busbar, EV high power connector, electric railroad module, EV motor terminal block, and PV, EV, and HEV inverter module. Its products are used in various industries, such as automobiles and new energy vehicles, portable communications and electronic products, electric power tools, and energy storage power stations. Shenzhen Kedali Industry Co., Ltd. was founded in 1996 and is headquartered in Shenzhen, China.
Hisse Fiyatı
$21.68
Piyasa Değeri
$6.21B
Değişim (1 gün)
-0.19%
Değişim (1 yıl)
-9.58%
Ülke
CN
Ticaret Shenzhen Kedali Industry Co., Ltd. (002850)


Kategori
Industrials
Shenzhen Kedali Industry Co., Ltd. (002850) için Faaliyet Marjı
October 2026 itibarıyla Faaliyet Marjı TTM: 12.73%
Shenzhen Kedali Industry Co., Ltd. şirketinin en son finansal raporlarına ve hisse fiyatına göre, mevcut faaliyet marjı (TTM) 12.73%'dir. 2024 yılı sonunda şirketin faaliyet marjı 14.29% idi.
Shenzhen Kedali Industry Co., Ltd. için 2011 ile 2026 arasındaki Faaliyet Marjı geçmişi
Her yıl sonunda Faaliyet Marjı
| Yıl | Faaliyet Marjı | Değiştir |
|---|---|---|
| 2026 (TTM) | 12.73% | -12.02% |
| 2025 | 14.47% | 1.26% |
| 2024 | 14.29% | 9.50% |
| 2023 | 13.05% | 9.39% |
| 2022 | 11.93% | -12.41% |
| 2021 | 13.62% | 34.99% |
| 2020 | 10.09% | -17.57% |
| 2019 | 12.24% | 145.78% |
| 2018 | 4.98% | -63.94% |
| 2017 | 13.81% | -25.23% |
| 2016 | 18.47% | 15.44% |
| 2015 | 16.00% | 26.38% |
| 2014 | 12.66% | 6.93% |
| 2013 | 11.84% | -16.68% |
| 2012 | 14.21% | 114.65% |
| 2011 | 6.62% | 0.00% |
Benzer şirketler veya rakipler için Faaliyet Marjı
| Şirket | Faaliyet Marjı | Faaliyet Marjı Farkı | Ülke |
|---|---|---|---|
| 17.57% | -98.62% |
CH
|
|
| 16.36% | -98.71% |
CN
|
|
| 17.68% | -98.61% |
IE
|
|
| 13.19% | -98.96% |
TH
|
|
| 19.40% | -98.48% |
US
|


Bir şirketin Faaliyet Marjı'ı nedir?
Faaliyet Marjı, bir şirketin kârlılığını değerlendirmek için temel bir göstergedir. Daha yüksek Faaliyet Marjı değerleri genellikle daha iyidir çünkü bir şirketin ürün veya hizmetlerini üretim maliyetlerinden çok daha yüksek bir fiyata satabildiğini gösterir. Faaliyet Marjı, şirketin kârının gelirine bölünmesiyle hesaplanır.