


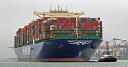
HMM Co.,Ltd
011200
อันดับในหุ้น
#1444
As a global, integrated logistics provider, HMM Co.,Ltd delivers comprehensive... As a global, integrated logistics provider, HMM Co.,Ltd delivers comprehensive shipping and freight forwarding solutions worldwide. The company facilitates the transport of a broad spectrum of goods, from vital bulk commodities like crude oil, coal, and iron ore, to specialized cargo and general import/export consignments. Its diverse fleet includes container ships, bulk carriers, various tankers (for crude oil and refined products), and trampers of different classes, such as Cape, Panamax, Supramax, and Handy vessels, alongside specialized heavy-lift and custom product carriers. Established in 1976, the company, originally known as Hyundai Merchant Marine Co.,Ltd, rebranded to HMM Co.,Ltd in March 2020. Its headquarters are situated in Seoul, South Korea.
ราคาหุ้น
$16.15
มูลค่าตลาด
$15.23B
การเปลี่ยนแปลง (1 วัน)
-0.43%
การเปลี่ยนแปลง (1 ปี)
14.44%
ประเทศ
KR
ซื้อขาย HMM Co.,Ltd (011200)


หมวดหมู่
Industrials
รายได้ของ HMM Co.,Ltd (011200)
รายได้ใน Jun 2026 TTM: $7.98B
จากรายงานทางการเงินล่าสุดของ HMM Co.,Ltd รายได้ปัจจุบันของบริษัท (TTM) คือ $7.98B ในปี 2023 บริษัทมีรายได้ $6.49B น้อยกว่ารายได้ในปี รายได้ในปี 2022 ซึ่งมีมูลค่า $14.73B รายได้คือจำนวนเงินรวมทั้งหมดที่บริษัทสร้างจากการขายสินค้า หรือบริการ ซึ่งแตกต่างจากกำไรเพราะไม่มีการหักค่าใช้จ่ายออกไป
ประวัติรายได้ของ HMM Co.,Ltd ตั้งแต่ 2007 ถึง 2026
รายได้ ณ สิ้นปีแต่ละปี
| ปี | รายได้ | เปลี่ยน |
|---|---|---|
| 2026 (TTM) | $7.98B | 0.22% |
| 2024 | $7.96B | 22.63% |
| 2023 | $6.49B | -55.93% |
| 2022 | $14.73B | 26.92% |
| 2021 | $11.60B | 96.41% |
| 2020 | $5.91B | 23.73% |
| 2019 | $4.77B | 1.80% |
| 2018 | $4.69B | -0.59% |
| 2017 | $4.72B | 24.07% |
| 2016 | $3.80B | -22.53% |
| 2015 | $4.91B | -20.76% |
| 2014 | $6.19B | -19.97% |
| 2013 | $7.74B | 2.40% |
| 2012 | $7.56B | 18.06% |
| 2011 | $6.40B | -18.93% |
| 2010 | $7.90B | 32.08% |
| 2009 | $5.98B | -13.60% |
| 2008 | $6.92B | 9.15% |
| 2007 | $6.34B | 0.00% |
รายได้ของบริษัทหรือคู่แข่งที่คล้ายกัน
| บริษัท | รายได้ | ความแตกต่างของรายได้ | ประเทศ |
|---|---|---|---|
| - | - |
KR
|
|
| - | - |
DK
|
|
| $4.46B | -44.06% |
IN
|
|
| - | - |
CN
|
|
| - | - |
PH
|


