


GATX Corporation
GATX
Ранг среди акций
#3128
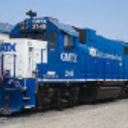
GATX Corporation, established in Chicago, Illinois in 1898, is a prominent... GATX Corporation, established in Chicago, Illinois in 1898, is a prominent global equipment lessor. The company primarily provides railcar and locomotive leasing services across North America and internationally, catering to vital industries such as petroleum, chemicals, food/agriculture, and transportation. Its operational framework is divided into three key segments: Rail North America, Rail International, and Portfolio Management. Beyond simply supplying equipment, GATX offers a comprehensive suite of support and maintenance services for its rail fleet. These include interior cleaning, routine upkeep and repairs to car bodies and safety features, ensuring regulatory compliance, facilitating wheelset replacements, performing interior blasting and lining, exterior painting, and applying car stenciling. Furthermore, GATX's activities extend to leasing aircraft spare engines (including units it directly owns) and managing a small collection of five liquefied gas-carrying vessels. The company also applies its expertise to overseeing asset portfolios on behalf of third parties. GATX maintains a substantial asset base, comprising approximately 147,000 railcars, a combined fleet of 568 locomotives (539 four-axle and 29 six-axle), and its five specialized vessels.
Цена акции
$163.75
Рыночная капитализация
$5.78B
Изменение (1 день)
-1.00%
Изменение (1 год)
-4.81%
Страна
US
Торговля GATX Corporation (GATX)


Категория
Industrials
Операционная маржа для GATX Corporation (GATX)
Операционная маржа на October 2026 TTM: 29.05%
Согласно последним финансовым отчетам и цене акций GATX Corporation, текущая операционная маржа (TTM) составляет 29.05%. В конце 2023 она составила 27.50%.
История операционной маржи GATX Corporation с 2000 по 2026
Операционная маржа на конец каждого года
| Год | Операционная маржа | Изменить |
|---|---|---|
| 2026 (TTM) | 29.05% | -2.75% |
| 2024 | 29.87% | 8.62% |
| 2023 | 27.50% | 2.92% |
| 2022 | 26.72% | 13.17% |
| 2021 | 23.61% | -0.51% |
| 2020 | 23.73% | 4.08% |
| 2019 | 22.80% | -0.70% |
| 2018 | 22.96% | -4.73% |
| 2017 | 24.10% | -6.95% |
| 2016 | 25.90% | 4.48% |
| 2015 | 24.79% | 13.87% |
| 2014 | 21.77% | 15.80% |
| 2013 | 18.80% | -2.24% |
| 2012 | 19.23% | -22.74% |
| 2011 | 24.89% | 7.61% |
| 2010 | 23.13% | -9.22% |
| 2009 | 25.48% | 63.75% |
| 2008 | 15.56% | -19.71% |
| 2007 | 19.38% | 2.87% |
| 2006 | 18.84% | -868.98% |
| 2005 | -2.45% | -113.31% |
| 2004 | 18.41% | 135.12% |
| 2003 | 7.83% | 169.07% |
| 2002 | 2.91% | -51.66% |
| 2001 | 6.02% | 56.36% |
| 2000 | 3.85% | 0.00% |
Операционная маржа для аналогичных компаний или конкурентов
| Компания | Операционная маржа | Разница в операционной марже | Страна |
|---|---|---|---|
| 24.79% | -99.15% |
US
|
|
| 0.00% | - |
US
|
|
| 52.80% | -98.18% |
IE
|
|
| 0.00% | - |
BR
|
|
| 6.88% | -99.76% |
US
|


Что такое операционная маржа компании?
Операционная маржа — это ключевой показатель прибыльности компании. Более высокая операционная маржа обычно означает, что компания может продавать свои товары или услуги значительно дороже их себестоимости. Она рассчитывается путем деления прибыли компании на её выручку.