


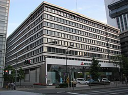
Mitsubishi Motors Corporation
7211
Ранг среди акций
#4837
Mitsubishi Motors Corporation, with its various subsidiaries, specializes in... Mitsubishi Motors Corporation, with its various subsidiaries, specializes in the development, production, and sale of passenger automobiles, along with their related parts and components. Its expansive global footprint covers markets such as Japan, Europe, North America, Oceania, the broader Asian continent, and other international regions. The company's operations are divided into two primary divisions: the Automobile Business and the Financial Service Business. Under the Mitsubishi marque, its diverse product portfolio encompasses electric vehicles (EVs), plug-in hybrid electric vehicles (PHEVs), sport utility vehicles (SUVs), pickup trucks, conventional passenger cars, minivans, and Kei-cars. Furthermore, the corporation is involved in vehicle transport and maintenance; provides auto sales financing, leasing, rental, and direct sales; conducts investigation, testing, and research pertinent to automobiles; manufactures automotive engines, transmissions, and pressed parts; and engages in wholesale trade. Mitsubishi Motors Corporation was founded in 1970 and is based in Tokyo, Japan.
Цена акции
$2.29
Рыночная капитализация
$3.06B
Изменение (1 день)
-0.96%
Изменение (1 год)
-12.01%
Страна
JP
Торговля Mitsubishi Motors Corporation (7211)


Категория
Consumer Cyclical
Выручка компании Mitsubishi Motors Corporation (7211)
Выручка на Jun 2026 TTM: $18.97B
Согласно последним финансовым отчетам Mitsubishi Motors Corporation, текущая выручка компании (TTM) составляет $18.97B. В 2024 году компания получила выручку $18.43B меньше, чем выручке в 2023 году, которая составила $18.51B. Выручка — это общий доход, который компания получает от продажи товаров или услуг. В отличие от прибыли, расходы не вычитаются.
История выручки Mitsubishi Motors Corporation с 2001 по 2026
Выручка на конец каждого года
| Год | Выручка | Изменить |
|---|---|---|
| 2026 (TTM) | $18.97B | 1.97% |
| 2025 | $18.60B | 0.92% |
| 2024 | $18.43B | -0.45% |
| 2023 | $18.51B | 10.56% |
| 2022 | $16.75B | 27.43% |
| 2021 | $13.14B | -37.77% |
| 2020 | $21.12B | -6.79% |
| 2019 | $22.65B | 9.79% |
| 2018 | $20.63B | 20.54% |
| 2017 | $17.12B | -15.07% |
| 2016 | $20.16B | 10.86% |
| 2015 | $18.18B | -10.42% |
| 2014 | $20.30B | 5.37% |
| 2013 | $19.26B | -11.58% |
| 2012 | $21.78B | -1.25% |
| 2011 | $22.06B | 42.59% |
| 2010 | $15.47B | -22.86% |
| 2009 | $20.06B | -25.43% |
| 2008 | $26.90B | 44.04% |
| 2007 | $18.67B | 3.61% |
| 2006 | $18.02B | -9.11% |
| 2005 | $19.83B | -18.04% |
| 2004 | $24.19B | -26.36% |
| 2003 | $32.86B | 36.03% |
| 2002 | $24.15B | -7.54% |
| 2001 | $26.12B | 0.00% |
Выручка аналогичных компаний или конкурентов
| Компания | Выручка | Разница в выручке | Страна |
|---|---|---|---|
| $103.62B | 446.27% |
US
|
|
| - | - |
JP
|
|
| - | - |
CN
|
|
| - | - |
IT
|
|
| $185.53B | 878.09% |
US
|


