


China Railway Construction Heavy Industry Corporation Limited
688425
Ранг среди акций
#4655
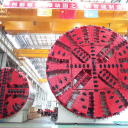
China Railway Construction Heavy Industry Corporation Limited (CRCHI) is a... China Railway Construction Heavy Industry Corporation Limited (CRCHI) is a prominent global manufacturer specializing in equipment for the underground construction and rail transit industries. The company's core product offerings include heavy machinery such as tunnel boring machines (TBMs), shaft-boring machines, drilling jumbos, and concrete sprayers. It also supplies specialized tunnel vehicles for lifting and installation tasks, along with critical rail infrastructure components like railway turnouts, clips, and fasteners. CRCHI further diversifies its product range to encompass New Austrian Tunneling Method (NATM) equipment, comprehensive rail track and maglev systems, various railway transit solutions, agricultural machinery, green building construction tools, coal mine equipment, and general construction materials. Beyond products, the company delivers a full suite of services, including design, fabrication, training, on-site support, equipment refurbishment, and spare parts provision. Established in 2007, CRCHI maintains its headquarters in Changsha, China, operating as a subsidiary under the umbrella of China Railway Construction Corporation Limited.
Цена акции
$0.60047469
Рыночная капитализация
$3.20B
Изменение (1 день)
0.50%
Изменение (1 год)
-25.58%
Страна
CN
Торговля China Railway Construction Heavy Industry Corporation Limited (688425)


Категория
Industrials
Коэффициент P/E для China Railway Construction Heavy Industry Corporation Limited (688425)
Коэффициент P/E на October 2026 TTM: 17.09
Согласно последним финансовым отчетам и цене акций China Railway Construction Heavy Industry Corporation Limited, текущий P/E (TTM) составляет 17.09. В конце 2024 у компании был P/E на уровне 15.71.
История P/E компании China Railway Construction Heavy Industry Corporation Limited с 2017 по 2026
P/E на конец каждого года
| Год | P/E коэффициент | Изменить |
|---|---|---|
| 2026 (TTM) | 17.09 | -5.66% |
| 2025 | 18.11 | 15.23% |
| 2024 | 15.71 | 18.45% |
| 2023 | 13.27 | 17.55% |
| 2022 | 11.29 | -15.62% |
| 2021 | 13.38 | -33.29% |
| 2020 | 20.05 | -2.44% |
| 2019 | 20.55 | 0.00% |
| 2018 | 0.00 | 0.00% |
| 2017 | 0.00 | 0.00% |
P/E для схожих компаний или конкурентов
| Компания | P/E Ratio | Разница P/E | Страна |
|---|---|---|---|
| 35.44 | 107.42% |
US
|
|
| 26.81 | 56.90% |
DE
|
|
| - | - |
FR
|
|
| 40.86 | 139.13% |
DE
|
|
| 33.09 | 93.68% |
US
|


Как читать P/E Ratio?
Коэффициент цена/прибыль (P/E Ratio) отражает соотношение между ценой акции компании и её прибылью на акцию.
Низкий, но положительный P/E говорит о том, что компания приносит высокую прибыль при низкой оценке и может быть недооценена. Высокий отрицательный (близкий к 0) P/E указывает на значительные убытки.
Компании с P/E выше 30 или отрицательным считаются "акциями роста" — инвесторы ожидают роста или будущей прибыли.
Компании с положительным P/E ниже 10 считаются "ценностными акциями", т.е. уже прибыльны, но с низким потенциалом роста.