


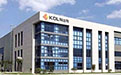
Shenzhen Kedali Industry Co., Ltd.
002850
Ранг среди акций
#2920
Shenzhen Kedali Industry Co., Ltd., together with its subsidiaries, engages in... Shenzhen Kedali Industry Co., Ltd., together with its subsidiaries, engages in the research, development, manufacture, and sale of precision battery structural components and automotive structural components parts in China and internationally. It offers prismatic can, mobile battery aluminum and cylindrical can, mobile battery prismatic can, power battery, precision structural part of lithium-ion battery, aluminum terminal, Cu-Al compound terminal, cylindrical explosion-proof lithium battery lid/cover/cap, busbar, copper busbar, and mobile batter prismatic can, as well as cylindrical collector, prismatic, and mobile lid/cover/cap. The company also provides auto parts, auto seats, armature, automotive central control instrument, EPB electric motor assembly, and auto door handle; and Cu-Al busbar, EV high power connector, electric railroad module, EV motor terminal block, and PV, EV, and HEV inverter module. Its products are used in various industries, such as automobiles and new energy vehicles, portable communications and electronic products, electric power tools, and energy storage power stations. Shenzhen Kedali Industry Co., Ltd. was founded in 1996 and is headquartered in Shenzhen, China.
Цена акции
$21.68
Рыночная капитализация
$6.21B
Изменение (1 день)
-0.19%
Изменение (1 год)
-9.58%
Страна
CN
Торговля Shenzhen Kedali Industry Co., Ltd. (002850)


Категория
Industrials
Операционная маржа для Shenzhen Kedali Industry Co., Ltd. (002850)
Операционная маржа на October 2026 TTM: 12.73%
Согласно последним финансовым отчетам и цене акций Shenzhen Kedali Industry Co., Ltd., текущая операционная маржа (TTM) составляет 12.73%. В конце 2024 она составила 14.29%.
История операционной маржи Shenzhen Kedali Industry Co., Ltd. с 2011 по 2026
Операционная маржа на конец каждого года
| Год | Операционная маржа | Изменить |
|---|---|---|
| 2026 (TTM) | 12.73% | -12.02% |
| 2025 | 14.47% | 1.26% |
| 2024 | 14.29% | 9.50% |
| 2023 | 13.05% | 9.39% |
| 2022 | 11.93% | -12.41% |
| 2021 | 13.62% | 34.99% |
| 2020 | 10.09% | -17.57% |
| 2019 | 12.24% | 145.78% |
| 2018 | 4.98% | -63.94% |
| 2017 | 13.81% | -25.23% |
| 2016 | 18.47% | 15.44% |
| 2015 | 16.00% | 26.38% |
| 2014 | 12.66% | 6.93% |
| 2013 | 11.84% | -16.68% |
| 2012 | 14.21% | 114.65% |
| 2011 | 6.62% | 0.00% |
Операционная маржа для аналогичных компаний или конкурентов
| Компания | Операционная маржа | Разница в операционной марже | Страна |
|---|---|---|---|
| 17.57% | -98.62% |
CH
|
|
| 16.36% | -98.71% |
CN
|
|
| 17.68% | -98.61% |
IE
|
|
| 13.19% | -98.96% |
TH
|
|
| 19.40% | -98.48% |
US
|


Что такое операционная маржа компании?
Операционная маржа — это ключевой показатель прибыльности компании. Более высокая операционная маржа обычно означает, что компания может продавать свои товары или услуги значительно дороже их себестоимости. Она рассчитывается путем деления прибыли компании на её выручку.