


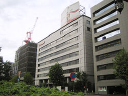
Nisshin Seifun Group Inc.
2002
Rang în acțiuni
#4265
Nisshin Seifun Group Inc., a Tokyo, Japan-based company established in 1900,... Nisshin Seifun Group Inc., a Tokyo, Japan-based company established in 1900, maintains a robust international presence through its multifaceted operations. Its diverse portfolio spans flour milling, where it produces wheat flour and bran, alongside a significant processed foods division. This division offers a wide array of products including pasta, pasta sauces, premixes, consumer-grade flours, and convenient heat-and-serve, dried, chilled, and frozen meals, marketed under popular brands like NISSHIN, MA?MA, AO-NO-DOKUTSU, and DE CECCO. The company also supplies deli foods via its INITIO brand. Beyond consumer goods, Nisshin Seifun is active in health foods, pharmaceutical products, and active pharmaceutical ingredient development. It also serves the pet food market with dog and cat products under the JP Style brand. Further diversifying its reach, the group includes an engineering arm that designs and manages facilities for processing grains, food materials, and chemicals, in addition to supplying powder processing equipment. In biotechnology, it produces yeast, various food ingredients, components for diagnostic drugs, and research-grade pharmaceuticals. Finally, its mesh cloth business segment delivers materials for screen-printing, industrial mesh products, electronic components, and plastic molding solutions.
Preț acțiune
$13.27
Ultima sincronizare: 2026-10-16
Capitalizare de piață
$3.71B
Schimbare (1 zi)
-0.39%
Schimbare (1 an)
11.39%
Țară
JP
Tranzacționează Nisshin Seifun Group Inc. (2002)


Categorie
Consumer Defensive
Marja operațională pentru Nisshin Seifun Group Inc. (2002)
Marja operațională la October 2026 TTM: 5.37%
Conform celor mai recente rapoarte financiare și prețului acțiunilor Nisshin Seifun Group Inc., marja operațională curentă (TTM) este 5.37%. La finalul anului 2024, compania avea o marjă operațională de 5.57%.
Istoricul marjei operaționale pentru Nisshin Seifun Group Inc. din 2004 până în 2026
Marja operațională la sfârșitul fiecărui an
| An | Marja Operațională | Schimbă |
|---|---|---|
| 2026 (TTM) | 5.37% | -1.47% |
| 2025 | 5.45% | -2.15% |
| 2024 | 5.57% | 35.52% |
| 2023 | 4.11% | -5.08% |
| 2022 | 4.33% | 8.25% |
| 2021 | 4.00% | -1.23% |
| 2020 | 4.05% | -14.92% |
| 2019 | 4.76% | -5.56% |
| 2018 | 5.04% | 5.22% |
| 2017 | 4.79% | 12.18% |
| 2016 | 4.27% | 9.77% |
| 2015 | 3.89% | -13.36% |
| 2014 | 4.49% | -5.87% |
| 2013 | 4.77% | -8.80% |
| 2012 | 5.23% | -12.40% |
| 2011 | 5.97% | -0.33% |
| 2010 | 5.99% | 28.54% |
| 2009 | 4.66% | 4.95% |
| 2008 | 4.44% | -3.27% |
| 2007 | 4.59% | -12.74% |
| 2006 | 5.26% | -4.36% |
| 2005 | 5.50% | 9.78% |
| 2004 | 5.01% | 0.00% |
Marja operațională pentru companii similare sau concurente
| Companie | Marja Operațională | Diferență în marja operațională | Țara |
|---|---|---|---|
| 14.06% | -97.38% |
CH
|
|
| 0.00% | - |
FR
|
|
| 0.00% | - |
JP
|
|
| 0.00% | - |
BR
|
|
| -13.04% | -102.43% |
US
|


Ce este marja operațională a unei companii?
Marja operațională este un indicator esențial pentru evaluarea profitabilității unei companii. Marjele operaționale mai mari sunt de obicei mai bune, deoarece arată că o companie poate vinde produsele sau serviciile sale la prețuri mult mai mari decât costurile de producție. Marja operațională se calculează împărțind profitul companiei la venitul său.