


HMM Co.,Ltd
011200
Rang în acțiuni
#1370
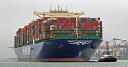
As a global, integrated logistics provider, HMM Co.,Ltd delivers comprehensive... As a global, integrated logistics provider, HMM Co.,Ltd delivers comprehensive shipping and freight forwarding solutions worldwide. The company facilitates the transport of a broad spectrum of goods, from vital bulk commodities like crude oil, coal, and iron ore, to specialized cargo and general import/export consignments. Its diverse fleet includes container ships, bulk carriers, various tankers (for crude oil and refined products), and trampers of different classes, such as Cape, Panamax, Supramax, and Handy vessels, alongside specialized heavy-lift and custom product carriers. Established in 1976, the company, originally known as Hyundai Merchant Marine Co.,Ltd, rebranded to HMM Co.,Ltd in March 2020. Its headquarters are situated in Seoul, South Korea.
Preț acțiune
$17.07
Capitalizare de piață
$16.10B
Schimbare (1 zi)
-3.21%
Schimbare (1 an)
17.16%
Țară
KR
Tranzacționează HMM Co.,Ltd (011200)


Categorie
Industrials
Venituri pentru HMM Co.,Ltd (011200)
Venituri în Jun 2026 TTM: $7.98B
Conform celor mai recente rapoarte financiare ale HMM Co.,Ltd, venitul actual al companiei (TTM) este $7.98B. În anul 2023, compania a avut un venit de $6.49B o scădere comparativ cu venitul din anul 2022, care a fost de $14.73B. Venitul reprezintă suma totală generată de o companie din vânzarea de bunuri sau servicii. Spre deosebire de profit, cheltuielile nu sunt scăzute.
Istoricul veniturilor pentru HMM Co.,Ltd din 2007 până în 2026
Venituri la sfârșitul fiecărui an
| An | Venituri | Schimbă |
|---|---|---|
| 2026 (TTM) | $7.98B | 0.22% |
| 2024 | $7.96B | 22.63% |
| 2023 | $6.49B | -55.93% |
| 2022 | $14.73B | 26.92% |
| 2021 | $11.60B | 96.41% |
| 2020 | $5.91B | 23.73% |
| 2019 | $4.77B | 1.80% |
| 2018 | $4.69B | -0.59% |
| 2017 | $4.72B | 24.07% |
| 2016 | $3.80B | -22.53% |
| 2015 | $4.91B | -20.76% |
| 2014 | $6.19B | -19.97% |
| 2013 | $7.74B | 2.40% |
| 2012 | $7.56B | 18.06% |
| 2011 | $6.40B | -18.93% |
| 2010 | $7.90B | 32.08% |
| 2009 | $5.98B | -13.60% |
| 2008 | $6.92B | 9.15% |
| 2007 | $6.34B | 0.00% |
Venituri pentru companii similare sau concurente
| Companie | Venituri | Diferență de venituri | Țara |
|---|---|---|---|
| - | - |
KR
|
|
| - | - |
DK
|
|
| $4.46B | -44.06% |
IN
|
|
| - | - |
CN
|
|
| - | - |
PH
|


