


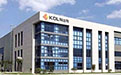
Shenzhen Kedali Industry Co., Ltd.
002850
Rang în acțiuni
#2921
Shenzhen Kedali Industry Co., Ltd., together with its subsidiaries, engages in... Shenzhen Kedali Industry Co., Ltd., together with its subsidiaries, engages in the research, development, manufacture, and sale of precision battery structural components and automotive structural components parts in China and internationally. It offers prismatic can, mobile battery aluminum and cylindrical can, mobile battery prismatic can, power battery, precision structural part of lithium-ion battery, aluminum terminal, Cu-Al compound terminal, cylindrical explosion-proof lithium battery lid/cover/cap, busbar, copper busbar, and mobile batter prismatic can, as well as cylindrical collector, prismatic, and mobile lid/cover/cap. The company also provides auto parts, auto seats, armature, automotive central control instrument, EPB electric motor assembly, and auto door handle; and Cu-Al busbar, EV high power connector, electric railroad module, EV motor terminal block, and PV, EV, and HEV inverter module. Its products are used in various industries, such as automobiles and new energy vehicles, portable communications and electronic products, electric power tools, and energy storage power stations. Shenzhen Kedali Industry Co., Ltd. was founded in 1996 and is headquartered in Shenzhen, China.
Preț acțiune
$21.68
Capitalizare de piață
$6.21B
Schimbare (1 zi)
-0.19%
Schimbare (1 an)
-9.58%
Țară
CN
Tranzacționează Shenzhen Kedali Industry Co., Ltd. (002850)


Categorie
Industrials
Câștiguri pentru Shenzhen Kedali Industry Co., Ltd. (002850)
Câștiguri în Jun 2026 TTM: $334.69M
Conform celor mai recente rapoarte financiare ale Shenzhen Kedali Industry Co., Ltd., câștigurile actuale ale companiei sunt $334.69M. În anul 2024, compania a înregistrat un câștig de $231.81M, o creștere față de câștigului din 2023, care a fost de $191.90M. Câștigurile afișate pe această pagină sunt cele înainte de dobânzi și impozite, cunoscute și ca EBIT.
Istoricul câștigurilor pentru Shenzhen Kedali Industry Co., Ltd. din 2011 până în 2026
Câștiguri la sfârșitul fiecărui an
| An | Câștiguri | Schimbă |
|---|---|---|
| 2026 (TTM) | $334.69M | 12.99% |
| 2025 | $296.20M | 27.78% |
| 2024 | $231.81M | 20.80% |
| 2023 | $191.90M | 28.64% |
| 2022 | $149.18M | 57.73% |
| 2021 | $94.58M | 216.99% |
| 2020 | $29.84M | -23.27% |
| 2019 | $38.88M | 174.47% |
| 2018 | $14.17M | -54.24% |
| 2017 | $30.96M | -21.75% |
| 2016 | $39.56M | 39.66% |
| 2015 | $28.33M | 104.24% |
| 2014 | $13.87M | 13.57% |
| 2013 | $12.21M | 25.05% |
| 2012 | $9.77M | 93.78% |
| 2011 | $5.04M | 0.00% |
Câștiguri pentru companii similare sau concurente
| Companie | Câștiguri | Diferență de câștiguri | Țara |
|---|---|---|---|
| - | - |
CH
|
|
| $16.45B | 4,814.49% |
CN
|
|
| $4.83B | 1,342.83% |
IE
|
|
| - | - |
TH
|
|
| $2.11B | 531.54% |
US
|


