


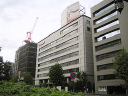
Nisshin Seifun Group Inc.
2002
Classificação em ações
#4235
Nisshin Seifun Group Inc., a Tokyo, Japan-based company established in 1900,... Nisshin Seifun Group Inc., a Tokyo, Japan-based company established in 1900, maintains a robust international presence through its multifaceted operations. Its diverse portfolio spans flour milling, where it produces wheat flour and bran, alongside a significant processed foods division. This division offers a wide array of products including pasta, pasta sauces, premixes, consumer-grade flours, and convenient heat-and-serve, dried, chilled, and frozen meals, marketed under popular brands like NISSHIN, MA?MA, AO-NO-DOKUTSU, and DE CECCO. The company also supplies deli foods via its INITIO brand. Beyond consumer goods, Nisshin Seifun is active in health foods, pharmaceutical products, and active pharmaceutical ingredient development. It also serves the pet food market with dog and cat products under the JP Style brand. Further diversifying its reach, the group includes an engineering arm that designs and manages facilities for processing grains, food materials, and chemicals, in addition to supplying powder processing equipment. In biotechnology, it produces yeast, various food ingredients, components for diagnostic drugs, and research-grade pharmaceuticals. Finally, its mesh cloth business segment delivers materials for screen-printing, industrial mesh products, electronic components, and plastic molding solutions.
Preço da ação
$13.41
Última sincronização: 2026-10-19
Valor de mercado
$3.75B
Variação (1 dia)
1.13%
Variação (1 ano)
12.22%
País
JP
Negociar Nisshin Seifun Group Inc. (2002)


Categoria
Consumer Defensive
Lucros da Nisshin Seifun Group Inc. (2002)
Lucros em Jun 2026 TTM: $312.81M
De acordo com os últimos relatórios financeiros da Nisshin Seifun Group Inc., os ganhos atuais da empresa são de $312.81M. Em 2024, a empresa teve ganhos de $322.75M, um aumento em relação a aos ganhos de 2023, que foram de $6.62M. Os ganhos apresentados nesta página são os ganhos antes de juros e impostos, conhecidos como EBIT.
Histórico de lucros da Nisshin Seifun Group Inc. de 2004 a 2026
Lucros no final de cada ano
| Ano | Lucros | Alterar |
|---|---|---|
| 2026 (TTM) | $312.81M | -12.05% |
| 2025 | $355.66M | 10.20% |
| 2024 | $322.75M | 4,775.20% |
| 2023 | $6.62M | -97.38% |
| 2022 | $252.74M | -5.94% |
| 2021 | $268.71M | -13.23% |
| 2020 | $309.69M | 3.81% |
| 2019 | $298.32M | -2.27% |
| 2018 | $305.23M | 9.00% |
| 2017 | $280.02M | 14.73% |
| 2016 | $244.08M | 15.13% |
| 2015 | $212.00M | -13.23% |
| 2014 | $244.33M | 2.61% |
| 2013 | $238.11M | -18.91% |
| 2012 | $293.63M | -5.72% |
| 2011 | $311.44M | -0.69% |
| 2010 | $313.61M | 25.47% |
| 2009 | $249.95M | 11.63% |
| 2008 | $223.90M | 9.86% |
| 2007 | $203.82M | -4.48% |
| 2006 | $213.37M | -8.86% |
| 2005 | $234.12M | 5.04% |
| 2004 | $222.89M | 0.00% |
Lucros de empresas semelhantes ou concorrentes
| Empresa | Lucros | Diferença de Lucros | País |
|---|---|---|---|
| $12.96B | 4,042.27% |
CH
|
|
| - | - |
FR
|
|
| - | - |
JP
|
|
| - | - |
BR
|
|
| - | - |
CN
|


