


Compañía de Minas Buenaventura S.A.A.
BVN
Pozycja w akcjach
#2519
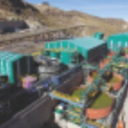
Compañía de Minas Buenaventura S.A.A. is a prominent Peruvian mining company... Compañía de Minas Buenaventura S.A.A. is a prominent Peruvian mining company focused on the exploration, development, processing, and commercialization of both precious and base metals. Its primary targets for extraction include gold, silver, lead, zinc, and copper. The company operates several key mining units within Peru, such as Tambomayo (Caylloma province), Orcopampa (Castilla province), Uchucchacua (Oyón province), and Julcani (Angaraes province). It also manages the San Gabriel project in the General Sánchez Cerro province, Moquegua region. Furthermore, Buenaventura holds significant interests in other notable mines, including Colquijirca, La Zanja, Yanacocha, Cerro Verde, El Brocal, Coimolache, Yumpaq, San Gregorio, and the Trapiche mining unit. Diversifying its operations, the company also produces manganese sulphate monohydrate and other mineral by-products, in addition to operating hydroelectric power plants. Established in 1953, Compañía de Minas Buenaventura S.A.A. is headquartered in Lima, Peru.
Cena akcji
$30.29
Kapitalizacja rynkowa
$7.69B
Zmiana (1 dzień)
0.26%
Zmiana (1 rok)
18.09%
Kraj
PE
Handel Compañía de Minas Buenaventura S.A.A. (BVN)


Kategoria
Basic Materials
Zyski dla Compañía de Minas Buenaventura S.A.A. (BVN)
Zyski w Jun 2026 TTM: $1.46B
Według najnowszych raportów finansowych Compañía de Minas Buenaventura S.A.A., obecny zysk firmy wynosi $1.46B. W roku 2023 firma osiągnęła zysk w wysokości $82.52M, spadek w porównaniu do zysku z roku 2022, który wynosił $124.43M. Wyświetlany zysk to zysk przed odsetkami i podatkami, czyli EBIT.
Historia zysków firmy Compañía de Minas Buenaventura S.A.A. od 2000 do 2026
Zyski na koniec każdego roku
| Rok | Zyski | Zmień |
|---|---|---|
| 2026 (TTM) | $1.46B | 153.93% |
| 2024 | $573.45M | 594.89% |
| 2023 | $82.52M | -33.68% |
| 2022 | $124.43M | 23.04% |
| 2021 | $101.13M | -274.06% |
| 2020 | $-58.10M | 2,871.82% |
| 2019 | $-1.96M | -108.70% |
| 2018 | $22.48M | -75.71% |
| 2017 | $92.55M | -136.26% |
| 2016 | $-255.24M | -27.34% |
| 2015 | $-351.26M | -1,089.84% |
| 2014 | $35.49M | 184.80% |
| 2013 | $12.46M | -98.59% |
| 2012 | $885.38M | -24.75% |
| 2011 | $1.18B | 39.45% |
| 2010 | $843.70M | 15.02% |
| 2009 | $733.54M | 326.58% |
| 2008 | $171.96M | -60.47% |
| 2007 | $435.06M | -26.82% |
| 2006 | $594.51M | 85.05% |
| 2005 | $321.27M | 26.52% |
| 2004 | $253.92M | 2,377.06% |
| 2003 | $10.25M | -91.29% |
| 2002 | $117.68M | 70.07% |
| 2001 | $69.19M | -27.02% |
| 2000 | $94.81M | 0.00% |
Zyski podobnych firm lub konkurentów
| Firma | Zyski | Różnica w zyskach | Kraj |
|---|---|---|---|
| - | - |
RU
|
|
| $-4.31B | -395.91% |
MX
|
|
| - | - |
SE
|
|
| - | - |
ID
|
|
| - | - |
ZA
|


