


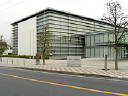
Kikkoman Corporation
2801
Pozycja w akcjach
#1916
Kikkoman Corporation, through its subsidiaries, engages in the manufacture and... Kikkoman Corporation, through its subsidiaries, engages in the manufacture and sale of food products in Japan and internationally. It offers soy sauce, soy sauce soup bases, and Del Monte seasonings; soy milk and Del Monte beverages; mirin and wines. The company also manufactures and sells canned fruits, corn products, and tomato ketchup; health foods; and purchases and sells oriental food products, as well as other products. In addition, it produces and sells clinical diagnostic enzymes, hygiene test agents, hyaluronic acid, as well as chemical products; and offers real estate rental, transportation, logistics, and warehousing services. The company was formerly known as Kikkoman Shoyu Co., Ltd. and changed its name to Kikkoman Corporation in 1980. Kikkoman Corporation was founded in 1917 and is headquartered in Noda, Japan.
Cena akcji
$11.91
Kapitalizacja rynkowa
$11.04B
Zmiana (1 dzień)
0.69%
Zmiana (1 rok)
39.01%
Kraj
JP
Handel Kikkoman Corporation (2801)


Kategoria
Consumer Defensive
Marża operacyjna dla Kikkoman Corporation (2801)
Marża operacyjna na dzień October 2026 TTM: 11.04%
Według najnowszych raportów finansowych i ceny akcji Kikkoman Corporation, bieżąca marża operacyjna (TTM) wynosi 11.04%. Na koniec 2024 wynosiła 11.11%.
Historia marży operacyjnej dla Kikkoman Corporation od 2006 do 2026
Marża operacyjna na koniec każdego roku
| Rok | Marża operacyjna | Zmień |
|---|---|---|
| 2026 (TTM) | 11.04% | 1.28% |
| 2025 | 10.90% | -1.89% |
| 2024 | 11.11% | 16.95% |
| 2023 | 9.50% | -6.13% |
| 2022 | 10.12% | 4.22% |
| 2021 | 9.71% | 14.24% |
| 2020 | 8.50% | 0.35% |
| 2019 | 8.47% | -0.12% |
| 2018 | 8.48% | 3.79% |
| 2017 | 8.17% | 2.38% |
| 2016 | 7.98% | 16.84% |
| 2015 | 6.83% | -1.73% |
| 2014 | 6.95% | 5.30% |
| 2013 | 6.60% | 5.26% |
| 2012 | 6.27% | -7.52% |
| 2011 | 6.78% | -8.13% |
| 2010 | 7.38% | 49.39% |
| 2009 | 4.94% | -14.24% |
| 2008 | 5.76% | 4.54% |
| 2007 | 5.51% | 6.78% |
| 2006 | 5.16% | 0.00% |
Marża operacyjna dla podobnych firm lub konkurentów
| Firma | Marża operacyjna | Różnica w marży operacyjnej | Kraj |
|---|---|---|---|
| 14.06% | -98.73% |
CH
|
|
| 0.00% | - |
FR
|
|
| 0.00% | - |
JP
|
|
| 0.00% | - |
BR
|
|
| -13.04% | -101.18% |
US
|


Czym jest marża operacyjna firmy?
Marża operacyjna to kluczowy wskaźnik do oceny rentowności firmy. Wyższe marże operacyjne są zazwyczaj korzystniejsze, ponieważ pokazują, że firma może sprzedawać swoje produkty lub usługi znacznie drożej niż koszty ich produkcji. Oblicza się ją, dzieląc zysk firmy przez jej przychody.