


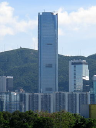
Swire Properties Limited
1972
Pozycja w akcjach
#1261
Swire Properties Limited is a real estate firm primarily focused on creating,... Swire Properties Limited is a real estate firm primarily focused on creating, owning, and managing diverse properties, with a strong emphasis on commercial developments. Its operational reach extends across Hong Kong, Mainland China, the United States, and various international markets. The company structures its activities across three core segments: Property Investment, Property Trading, and Hotels. Its work includes the development, leasing, and administration of commercial, retail, and residential sites, as well as the construction and sale of residential units, and the management of hotel establishments. Furthermore, it delivers financial services and operates as a real estate agency. Founded in Hong Kong in 1972, Swire Properties operates as a subsidiary of Swire Pacific Limited.
Cena akcji
$3.11
Kapitalizacja rynkowa
$17.93B
Zmiana (1 dzień)
-0.54%
Zmiana (1 rok)
12.59%
Kraj
HK
Handel Swire Properties Limited (1972)


Kategoria
Real Estate
Przychody dla Swire Properties Limited (1972)
Przychody w Jun 2026 TTM: $2.16B
Według najnowszych raportów finansowych Swire Properties Limited, obecny przychód firmy (TTM) wynosi $2.16B. W roku 2023 firma osiągnęła przychód w wysokości $1.98B wzrost w porównaniu do przychodu z roku 2022, który wynosił $1.78B. Przychód to całkowita kwota dochodu generowana przez firmę ze sprzedaży towarów lub usług. W przeciwieństwie do zysku, nie są odliczane żadne koszty.
Historia przychodów firmy Swire Properties Limited od 2010 do 2026
Przychody na koniec każdego roku
| Rok | Przychody | Zmień |
|---|---|---|
| 2026 (TTM) | $2.16B | 16.12% |
| 2024 | $1.86B | -6.36% |
| 2023 | $1.98B | 11.71% |
| 2022 | $1.78B | -15.39% |
| 2021 | $2.10B | 21.91% |
| 2020 | $1.72B | -6.03% |
| 2019 | $1.83B | -8.17% |
| 2018 | $2.00B | -18.56% |
| 2017 | $2.45B | 10.29% |
| 2016 | $2.22B | 2.15% |
| 2015 | $2.18B | 5.22% |
| 2014 | $2.07B | 21.42% |
| 2013 | $1.70B | -6.08% |
| 2012 | $1.81B | 47.00% |
| 2011 | $1.23B | 8.07% |
| 2010 | $1.14B | 0.00% |
Przychody podobnych firm lub konkurentów
| Firma | Przychody | Różnica w przychodach | Kraj |
|---|---|---|---|
| $12.09B | 460.32% |
HK
|
|
| - | - |
AE
|
|
| $37.42B | 1,634.02% |
HK
|
|
| $9.53B | 341.83% |
HK
|
|
| $6.82B | 216.09% |
JP
|


