


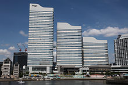
JGC Holdings Corporation
1963
Pozycja w akcjach
#4594
JGC Holdings Corporation, together with its subsidiaries, delivers... JGC Holdings Corporation, together with its subsidiaries, delivers comprehensive engineering, procurement, and construction (EPC) solutions for a wide array of industrial plants and facilities worldwide. The company operates through two primary segments: Total Engineering and Functional Materials Manufacturing. Its Total Engineering division offers end-to-end services, encompassing design, procurement, construction, and performance testing for projects across diverse sectors such as oil, gas, and petrochemicals; chemical production; nuclear energy; metal refining; biotechnology; food processing; and pharmaceuticals. This segment also addresses critical infrastructure including logistics, information technology, environmental protection, and pollution control. Concurrently, the Functional Materials Manufacturing segment is responsible for producing and supplying various specialized chemicals and catalysts, including FCC, hydrotreating, deNOx, and petrochemical catalysts. This division also develops and markets functional materials such as colloidal silica, coating materials for surface treatment on cathode ray tubes, semiconductor materials, and cosmetic ingredients, alongside a range of fine ceramic products. JGC maintains a significant global footprint, with operations spanning Japan, East and Southeast Asia, the Middle East, Africa, and North America. Founded in 1928 and headquartered in Yokohama, Japan, the company was formerly known as JGC Corporation, changing its name to JGC Holdings Corporation in October 2019.
Cena akcji
$13.78
Ostatnia synchronizacja: 2026-10-16
Kapitalizacja rynkowa
$3.33B
Zmiana (1 dzień)
1.25%
Zmiana (1 rok)
40.43%
Kraj
JP
Handel JGC Holdings Corporation (1963)


Kategoria
Industrials
Marża operacyjna dla JGC Holdings Corporation (1963)
Marża operacyjna na dzień October 2026 TTM: 5.58%
Według najnowszych raportów finansowych i ceny akcji JGC Holdings Corporation, bieżąca marża operacyjna (TTM) wynosi 5.58%. Na koniec 2024 wynosiła -2.28%.
Historia marży operacyjnej dla JGC Holdings Corporation od 2000 do 2026
Marża operacyjna na koniec każdego roku
| Rok | Marża operacyjna | Zmień |
|---|---|---|
| 2026 (TTM) | 5.58% | -516.42% |
| 2025 | -1.34% | -41.23% |
| 2024 | -2.28% | -137.69% |
| 2023 | 6.05% | 25.26% |
| 2022 | 4.83% | -8.35% |
| 2021 | 5.27% | 25.18% |
| 2020 | 4.21% | 12.27% |
| 2019 | 3.75% | 26.26% |
| 2018 | 2.97% | -195.81% |
| 2017 | -3.10% | -154.96% |
| 2016 | 5.64% | 51.61% |
| 2015 | 3.72% | -63.17% |
| 2014 | 10.10% | -1.66% |
| 2013 | 10.27% | -14.70% |
| 2012 | 12.04% | -15.27% |
| 2011 | 14.21% | 40.42% |
| 2010 | 10.12% | -12.23% |
| 2009 | 11.53% | 41.47% |
| 2008 | 8.15% | 87.79% |
| 2007 | 4.34% | 16.98% |
| 2006 | 3.71% | 22.04% |
| 2005 | 3.04% | -19.58% |
| 2004 | 3.78% | -16.37% |
| 2003 | 4.52% | -24.16% |
| 2002 | 5.96% | 81.16% |
| 2001 | 3.29% | -16.28% |
| 2000 | 3.93% | 0.00% |
Marża operacyjna dla podobnych firm lub konkurentów
| Firma | Marża operacyjna | Różnica w marży operacyjnej | Kraj |
|---|---|---|---|
| 6.20% | -98.89% |
US
|
|
| 12.24% | -97.81% |
FR
|
|
| 8.47% | -98.48% |
IN
|
|
| 16.46% | -97.05% |
US
|
|
| 0.00% | - |
NL
|


Czym jest marża operacyjna firmy?
Marża operacyjna to kluczowy wskaźnik do oceny rentowności firmy. Wyższe marże operacyjne są zazwyczaj korzystniejsze, ponieważ pokazują, że firma może sprzedawać swoje produkty lub usługi znacznie drożej niż koszty ich produkcji. Oblicza się ją, dzieląc zysk firmy przez jej przychody.