


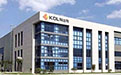
Shenzhen Kedali Industry Co., Ltd.
002850
Pozycja w akcjach
#2920
Shenzhen Kedali Industry Co., Ltd., together with its subsidiaries, engages in... Shenzhen Kedali Industry Co., Ltd., together with its subsidiaries, engages in the research, development, manufacture, and sale of precision battery structural components and automotive structural components parts in China and internationally. It offers prismatic can, mobile battery aluminum and cylindrical can, mobile battery prismatic can, power battery, precision structural part of lithium-ion battery, aluminum terminal, Cu-Al compound terminal, cylindrical explosion-proof lithium battery lid/cover/cap, busbar, copper busbar, and mobile batter prismatic can, as well as cylindrical collector, prismatic, and mobile lid/cover/cap. The company also provides auto parts, auto seats, armature, automotive central control instrument, EPB electric motor assembly, and auto door handle; and Cu-Al busbar, EV high power connector, electric railroad module, EV motor terminal block, and PV, EV, and HEV inverter module. Its products are used in various industries, such as automobiles and new energy vehicles, portable communications and electronic products, electric power tools, and energy storage power stations. Shenzhen Kedali Industry Co., Ltd. was founded in 1996 and is headquartered in Shenzhen, China.
Cena akcji
$21.68
Kapitalizacja rynkowa
$6.21B
Zmiana (1 dzień)
-0.19%
Zmiana (1 rok)
-9.58%
Kraj
CN
Handel Shenzhen Kedali Industry Co., Ltd. (002850)


Kategoria
Industrials
Liczba akcji w obrocie dla Shenzhen Kedali Industry Co., Ltd. (002850)
Liczba akcji w obrocie na dzień June 2026: 277.31M
Zgodnie z najnowszymi raportami finansowymi i ceną akcji Shenzhen Kedali Industry Co., Ltd., aktualna liczba akcji w obrocie to 277.31M. Na koniec December 2024 firma posiadała 270.52M akcji w obrocie. Liczba akcji w obrocie jest zwykle kształtowana przez podziały akcji i skupy akcji.
Historia liczby akcji w obrocie dla Shenzhen Kedali Industry Co., Ltd. (002850) od 2011 do 2026
Akcje w obrocie na koniec każdego roku
| Rok | Akcje w obrocie | Zmień |
|---|---|---|
| 2026 (TTM) | 277.31M | 1.40% |
| 2025 | 273.49M | 1.10% |
| 2024 | 270.52M | 8.58% |
| 2023 | 249.14M | 6.71% |
| 2022 | 233.47M | 0.23% |
| 2021 | 232.92M | 9.52% |
| 2020 | 212.67M | 1.27% |
| 2019 | 210.00M | 0.00% |
| 2018 | 210.00M | 3.73% |
| 2017 | 202.46M | 28.78% |
| 2016 | 157.21M | -0.27% |
| 2015 | 157.64M | 1.44% |
| 2014 | 155.40M | 6.40% |
| 2013 | 146.05M | 2.67% |
| 2012 | 142.25M | 6.83% |
| 2011 | 133.15M | 0.00% |
Akcje w obrocie dla podobnych firm lub konkurentów
| Firma | Akcje w obrocie | Różnica | Kraj |
|---|---|---|---|
| - | - |
CH
|
|
| 4.59B | 1,554.46% |
CN
|
|
| 388.50M | 40.10% |
IE
|
|
| - | - |
TH
|
|
| 384.56M | 38.67% |
US
|


