


China Railway Construction Heavy Industry Corporation Limited
688425
Rangering i aksjer
#4654
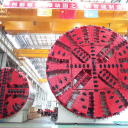
China Railway Construction Heavy Industry Corporation Limited (CRCHI) is a... China Railway Construction Heavy Industry Corporation Limited (CRCHI) is a prominent global manufacturer specializing in equipment for the underground construction and rail transit industries. The company's core product offerings include heavy machinery such as tunnel boring machines (TBMs), shaft-boring machines, drilling jumbos, and concrete sprayers. It also supplies specialized tunnel vehicles for lifting and installation tasks, along with critical rail infrastructure components like railway turnouts, clips, and fasteners. CRCHI further diversifies its product range to encompass New Austrian Tunneling Method (NATM) equipment, comprehensive rail track and maglev systems, various railway transit solutions, agricultural machinery, green building construction tools, coal mine equipment, and general construction materials. Beyond products, the company delivers a full suite of services, including design, fabrication, training, on-site support, equipment refurbishment, and spare parts provision. Established in 2007, CRCHI maintains its headquarters in Changsha, China, operating as a subsidiary under the umbrella of China Railway Construction Corporation Limited.
Aksjekurs
$0.60047469
Markedsverdi
$3.20B
Endring (1 dag)
0.50%
Endring (1 år)
-25.58%
Land
CN
Handel China Railway Construction Heavy Industry Corporation Limited (688425)


Kategori
Industrials
P/E-forhold for China Railway Construction Heavy Industry Corporation Limited (688425)
P/E-forhold per October 2026 TTM: 17.09
Ifølge China Railway Construction Heavy Industry Corporation Limited sine siste finansielle rapporter og aksjekurs er selskapets nåværende P/E-forhold (TTM) 17.09. Ved slutten av 2024 hadde selskapet en P/E på 15.71.
P/E-forholdshistorikk for China Railway Construction Heavy Industry Corporation Limited fra 2017 til 2026
P/E-forhold ved slutten av hvert år
| År | P/E-forhold | Endre |
|---|---|---|
| 2026 (TTM) | 17.09 | -5.66% |
| 2025 | 18.11 | 15.23% |
| 2024 | 15.71 | 18.45% |
| 2023 | 13.27 | 17.55% |
| 2022 | 11.29 | -15.62% |
| 2021 | 13.38 | -33.29% |
| 2020 | 20.05 | -2.44% |
| 2019 | 20.55 | 0.00% |
| 2018 | 0.00 | 0.00% |
| 2017 | 0.00 | 0.00% |
P/E-forhold for lignende selskaper eller konkurrenter
| Selskap | P/E-forhold | Forskjell i P/E-forhold | Land |
|---|---|---|---|
| 35.44 | 107.42% |
US
|
|
| 26.81 | 56.90% |
DE
|
|
| - | - |
FR
|
|
| 40.86 | 139.13% |
DE
|
|
| 33.09 | 93.68% |
US
|


Hvordan lese en P/E-ratio?
Pris/inntjening-forholdet (P/E) måler forholdet mellom aksjekursen og inntjening per aksje.
En lav men positiv P/E indikerer høy inntjening sammenlignet med nåværende verdsettelse, og kan tyde på at selskapet er undervurdert. En høy negativ (nær 0) P/E indikerer store tap.
Selskaper med P/E over 30 eller negativ betraktes vanligvis som "vekstaksjer", hvor investorer forventer vekst eller fremtidig lønnsomhet.
Selskaper med en positiv P/E under 10 anses vanligvis som "verdiaksjer", det vil si at selskapet allerede er lønnsomt, men har begrenset vekstpotensial.