


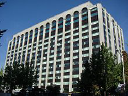
Hyundai Engineering & Construction Co.,Ltd.
000720
Rangering i aksjer
#2464
HYUNDAI ENGINEERING & CONSTRUCTION Co., Ltd. engages in the provision of civil... HYUNDAI ENGINEERING & CONSTRUCTION Co., Ltd. engages in the provision of civil engineering and construction services. It operates through the following divisions: Civil Engineering, Architecture and Housing, Plant and New Energy, and Others. The Civil Engineering division offers marine ports, tunnels, bridges, roads, residential land development, and offshore wind power. The Architecture and Housing division focuses on co-housing, data centers, and mixed-use developments. The Plant and New Energy division includes petrochemicals, gas processing, oil refining, new industrial plants, large nuclear power plants, next-generation nuclear power plants, solar power, water electrolysis hydrogen plants, ESS, transmission, and substation infrastructure. The Others division relates to real estate development, real estate rental, livestock farming, and resort condominium operation. The company was founded in May 1947 and is headquartered in Seoul, South Korea.
Aksjekurs
$69.85
Markedsverdi
$7.78B
Endring (1 dag)
0.22%
Endring (1 år)
69.74%
Land
KR
Handel Hyundai Engineering & Construction Co.,Ltd. (000720)


Kategori
Industrials
Aksjeprishistorikk for Hyundai Engineering & Construction Co.,Ltd. (000720)
Høyeste sluttskurs: $70.80 den 2026-10-01
Laveste sluttskurs: $633.31 den 1995-05-01
Laveste sluttskurs: $633.31 den 1995-05-01
Aksjeprishistorikk for Hyundai Engineering & Construction Co.,Ltd. fra 1995 til 2026
Årlig aksjeprisytelse
| År | Ytelse |
|---|---|
| 2026 (TTM) | 65.25% |
| 2025 | 167.98% |
| 2024 | -33.88% |
| 2023 | -4.41% |
| 2022 | -28.56% |
| 2021 | 18.59% |
| 2020 | -6.22% |
| 2019 | -28.05% |
| 2018 | 51.94% |
| 2017 | -8.45% |
| 2016 | 41.23% |
| 2015 | -34.33% |
| 2014 | -32.95% |
| 2013 | -11.29% |
| 2012 | 6.92% |
| 2011 | 1.99% |
| 2010 | 3.21% |
| 2009 | 43.23% |
| 2008 | -56.01% |
| 2007 | 47.93% |
| 2006 | 48.78% |
| 2005 | 202.17% |
| 2004 | 86.67% |
| 2003 | -48.08% |
| 2002 | -38.64% |
| 2001 | -62.17% |
| 2000 | -78.03% |
| 1999 | 24.16% |
| 1998 | 9.57% |
| 1997 | -46.26% |
| 1996 | -45.88% |
| 1995 | 0.00% |
Aksjepris for lignende selskaper eller konkurrenter
| Selskap | Aksjepris | Endring 1år% | Land |
|---|---|---|---|
| $551.37 | 33.76% |
US
|
|
| $118.87 | -16.23% |
FR
|
|
| $38.69 | -12.40% |
IN
|
|
| $1.27K | 61.09% |
US
|
|
| $49.56 | -21.38% |
NL
|


