


GATX Corporation
GATX
Rang in aandelen
#3139
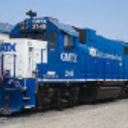
GATX Corporation, established in Chicago, Illinois in 1898, is a prominent... GATX Corporation, established in Chicago, Illinois in 1898, is a prominent global equipment lessor. The company primarily provides railcar and locomotive leasing services across North America and internationally, catering to vital industries such as petroleum, chemicals, food/agriculture, and transportation. Its operational framework is divided into three key segments: Rail North America, Rail International, and Portfolio Management. Beyond simply supplying equipment, GATX offers a comprehensive suite of support and maintenance services for its rail fleet. These include interior cleaning, routine upkeep and repairs to car bodies and safety features, ensuring regulatory compliance, facilitating wheelset replacements, performing interior blasting and lining, exterior painting, and applying car stenciling. Furthermore, GATX's activities extend to leasing aircraft spare engines (including units it directly owns) and managing a small collection of five liquefied gas-carrying vessels. The company also applies its expertise to overseeing asset portfolios on behalf of third parties. GATX maintains a substantial asset base, comprising approximately 147,000 railcars, a combined fleet of 568 locomotives (539 four-axle and 29 six-axle), and its five specialized vessels.
Aandeelprijs
$163.41
Marktkapitalisatie
$5.77B
Verandering (1 dag)
1.11%
Verandering (1 jaar)
0.24%
Land
US
Handel GATX Corporation (GATX)


Categorie
Industrials
P/E-ratio voor GATX Corporation (GATX)
P/E-ratio op October 2026 TTM: 16.30
Volgens de meest recente financiële rapporten en aandelenkoers van GATX Corporation is de huidige P/E-ratio (TTM) 16.30. Eind 2023 had het bedrijf een P/E van 16.56.
Historiek van P/E-ratio voor GATX Corporation van 2000 tot 2026
P/E-ratio aan het einde van elk jaar
| Jaar | P/E-verhouding | Wijzigen |
|---|---|---|
| 2026 (TTM) | 16.30 | -16.48% |
| 2024 | 19.52 | 17.89% |
| 2023 | 16.56 | -31.43% |
| 2022 | 24.15 | -6.32% |
| 2021 | 25.77 | 33.95% |
| 2020 | 19.24 | 17.62% |
| 2019 | 16.36 | 29.83% |
| 2018 | 12.60 | 162.27% |
| 2017 | 4.80 | -50.47% |
| 2016 | 9.70 | 8.59% |
| 2015 | 8.93 | -29.28% |
| 2014 | 12.63 | -11.66% |
| 2013 | 14.30 | -3.12% |
| 2012 | 14.76 | -19.28% |
| 2011 | 18.28 | -9.17% |
| 2010 | 20.13 | 21.78% |
| 2009 | 16.53 | 119.77% |
| 2008 | 7.52 | -16.29% |
| 2007 | 8.99 | -54.58% |
| 2006 | 19.78 | -115.65% |
| 2005 | -126.42 | -1,569.84% |
| 2004 | 8.60 | -51.84% |
| 2003 | 17.86 | -99.52% |
| 2002 | 3.72K | 40,610.51% |
| 2001 | 9.13 | -74.54% |
| 2000 | 35.88 | 0.00% |
P/E-ratio voor vergelijkbare bedrijven of concurrenten
| Bedrijf | P/E-ratio | Verschil in P/E-ratio | Land |
|---|---|---|---|
| 24.96 | 53.09% |
US
|
|
| - | - |
US
|
|
| 6.98 | -57.16% |
IE
|
|
| - | - |
BR
|
|
| 294.32 | 1,705.20% |
US
|


Hoe lees je een P/E-ratio?
De koers-winstverhouding (P/E Ratio) meet de relatie tussen de aandelenprijs van een bedrijf en de winst per aandeel.
Een lage maar positieve P/E duidt op een bedrijf dat hoge winsten genereert ten opzichte van zijn huidige waardering en mogelijk ondergewaardeerd is. Een bedrijf met een hoge negatieve (dicht bij 0) P/E lijdt grote verliezen.
Bedrijven met een P/E boven 30 of een negatieve waarde worden meestal gezien als "groeiaandelen", wat betekent dat beleggers verwachten dat het bedrijf zal groeien of winstgevend zal worden.
Bedrijven met een positieve P/E onder de 10 worden meestal gezien als "waardeaandelen", wat betekent dat ze al zeer winstgevend zijn, maar weinig groei wordt verwacht.