


HMM Co.,Ltd
011200
Kedudukan dalam Saham
#1371
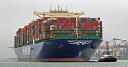
As a global, integrated logistics provider, HMM Co.,Ltd delivers comprehensive... As a global, integrated logistics provider, HMM Co.,Ltd delivers comprehensive shipping and freight forwarding solutions worldwide. The company facilitates the transport of a broad spectrum of goods, from vital bulk commodities like crude oil, coal, and iron ore, to specialized cargo and general import/export consignments. Its diverse fleet includes container ships, bulk carriers, various tankers (for crude oil and refined products), and trampers of different classes, such as Cape, Panamax, Supramax, and Handy vessels, alongside specialized heavy-lift and custom product carriers. Established in 1976, the company, originally known as Hyundai Merchant Marine Co.,Ltd, rebranded to HMM Co.,Ltd in March 2020. Its headquarters are situated in Seoul, South Korea.
Harga Saham
$17.03
Modal Pasaran
$16.06B
Perubahan (1 hari)
-3.42%
Perubahan (1 tahun)
16.90%
Negara
KR
Perdagangan HMM Co.,Ltd (011200)


Kategori
Industrials
Hasil untuk HMM Co.,Ltd (011200)
Hasil pada Jun 2026 TTM: $7.98B
Menurut laporan kewangan terkini daripada HMM Co.,Ltd, hasil semasa syarikat (TTM) ialah $7.98B. Pada tahun 2023, syarikat memperoleh hasil sebanyak $6.49B penurunan berbanding hasil pada tahun 2022 iaitu $14.73B. Hasil ialah jumlah pendapatan keseluruhan yang dijana oleh syarikat daripada jualan barangan atau perkhidmatan. Tidak seperti keuntungan, tiada perbelanjaan ditolak.
Sejarah hasil bagi HMM Co.,Ltd dari 2007 hingga 2026
Hasil pada akhir setiap tahun
| Tahun | Hasil | Ubah |
|---|---|---|
| 2026 (TTM) | $7.98B | 0.22% |
| 2024 | $7.96B | 22.63% |
| 2023 | $6.49B | -55.93% |
| 2022 | $14.73B | 26.92% |
| 2021 | $11.60B | 96.41% |
| 2020 | $5.91B | 23.73% |
| 2019 | $4.77B | 1.80% |
| 2018 | $4.69B | -0.59% |
| 2017 | $4.72B | 24.07% |
| 2016 | $3.80B | -22.53% |
| 2015 | $4.91B | -20.76% |
| 2014 | $6.19B | -19.97% |
| 2013 | $7.74B | 2.40% |
| 2012 | $7.56B | 18.06% |
| 2011 | $6.40B | -18.93% |
| 2010 | $7.90B | 32.08% |
| 2009 | $5.98B | -13.60% |
| 2008 | $6.92B | 9.15% |
| 2007 | $6.34B | 0.00% |
Hasil untuk syarikat atau pesaing serupa
| Syarikat | Hasil | Perbezaan Hasil | Negara |
|---|---|---|---|
| - | - |
KR
|
|
| - | - |
DK
|
|
| $4.46B | -44.06% |
IN
|
|
| - | - |
CN
|
|
| - | - |
PH
|


