


SRF Limited
SRF
주식 순위
#2456
SRF Limited is a diversified conglomerate that manufactures, sources, and... SRF Limited is a diversified conglomerate that manufactures, sources, and distributes technical textiles, chemicals, packaging films, and other polymer products. The company operates through key segments: Technical Textiles, Chemicals, Packaging Film, and an 'Others' division. Its Technical Textiles division offers products such as nylon tire cord, belting, coated, and laminated fabrics, as well as industrial and polyester yarns. The Chemicals segment delivers a wide array of products, including fluorochemicals. These comprise refrigerants, sold under the Floron brand, for residential and automotive air conditioners, refrigerators, and chillers, along with Dymel-branded propellants for the pharmaceutical industry. Industrial chemicals are also a core offering, serving as pharmaceutical solvents, feedstock for agrochemical and pharmaceutical synthesis, and for applications like metal degreasing, stainless steel and glass etching, and dry-foam blowing cleaning. Additionally, it provides advanced intermediates crucial for the agrochemical and pharmaceutical industries. The Packaging Film business is dedicated to bi-axially oriented polyethylene terephthalate (PETLAR) and bi-axially oriented polypropylene (OPLAR) films. Serving both domestic and international markets, SRF's reach extends across India, Germany, the United States, Belgium, Switzerland, and other countries globally. Founded in 1970 and headquartered in Gurugram, India, the company originally operated as Shri Ram Fibres before being rebranded SRF Limited in 1990. It operates as a subsidiary of KAMA Holdings Limited.
주가
$26.84
마지막 동기화: 2026-10-19
시가총액
$7.96B
변동 (1일)
-1.38%
변동 (1년)
-25.83%
국가
IN
거래 SRF Limited (SRF)


카테고리
Basic Materials
SRF Limited (SRF)의 P/E 비율
October 2026 기준 P/E 비율 TTM: 34.19
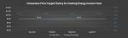
SRF Limited의 최신 재무 보고서와 주가에 따르면 현재 P/E (TTM) 비율은 34.19입니다. 2024년 말 기준 P/E 비율은 58.07였습니다.
SRF Limited의 P/E 비율 기록 (2005 ~ 2026)
매년 말 P/E 비율
| 연도 | P/E 비율 | 변화 |
|---|---|---|
| 2026 (TTM) | 34.19 | -49.89% |
| 2025 | 68.24 | 17.52% |
| 2024 | 58.07 | 75.63% |
| 2023 | 33.06 | -21.33% |
| 2022 | 42.03 | 59.66% |
| 2021 | 26.33 | 67.69% |
| 2020 | 15.70 | -25.74% |
| 2019 | 21.14 | -14.50% |
| 2018 | 24.73 | 36.29% |
| 2017 | 18.14 | 2.13% |
| 2016 | 17.76 | -5.56% |
| 2015 | 18.81 | 48.00% |
| 2014 | 12.71 | 216.78% |
| 2013 | 4.01 | 3.83% |
| 2012 | 3.86 | -2.91% |
| 2011 | 3.98 | 8.03% |
| 2010 | 3.68 | 9.47% |
| 2009 | 3.37 | -33.70% |
| 2008 | 5.08 | 82.74% |
| 2007 | 2.78 | -86.68% |
| 2006 | 20.85 | 115.55% |
| 2005 | 9.67 | 0.00% |
유사 기업 또는 경쟁사의 P/E 비율
| 회사 | P/E 비율 | P/E 비율 차이 | 국가 |
|---|---|---|---|
| 31.66 | -7.39% |
GB
|
|
| - | - |
FR
|
|
| 29.64 | -13.32% |
US
|
|
| 38.37 | 12.23% |
US
|
|
| -1.41K | -4,213.26% |
US
|


P/E 비율 읽는 방법
P/E 비율은 회사의 주가와 주당순이익 간의 관계를 측정합니다.
낮지만 양수인 P/E는 현재 가치 대비 높은 수익을 내고 있는 저평가된 기업을 의미합니다. 높은 음수(0에 가까운) P/E는 큰 손실을 나타냅니다.
P/E가 30을 초과하거나 음수인 기업은 일반적으로 '성장주'로 간주되며, 투자자들은 향후 수익성 개선을 기대합니다.
양의 P/E가 10 미만인 기업은 일반적으로 '가치주'로 간주되며, 이미 매우 수익성이 높고 향후 큰 성장은 기대되지 않습니다.