


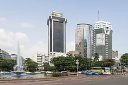
PT Indosat Ooredoo Hutchison Tbk
ISAT
株式のランク
#4763
PT Indosat Ooredoo Hutchison Tbk, along with its affiliates, delivers... PT Indosat Ooredoo Hutchison Tbk, along with its affiliates, delivers telecommunication services across Indonesia. For individual customers, the company provides both post-paid and prepaid options, encompassing a range of data and mobile voice solutions. These are accessible via its 2G, 3G, and 4G broadband cellular infrastructure, primarily under the IM3 Ooredoo brand. Additionally, their consumer offerings include international calls, global roaming, and fixed-line connectivity. Beyond individual users, the firm supports businesses with a suite of specialized services. This includes Internet of Things (IoT) and Machine-to-Machine (M2M) solutions, comprehensive IT services such as private data centers and disaster recovery facilities, and robust internet connectivity and data communication solutions for corporate clients. They also offer satellite-based services like transponder leasing, VSAT connectivity, and television channel broadcasting. Cloud-based platforms for business transformation and general voice services further diversify their portfolio. These services are collectively offered under the overarching Ooredoo brand. Founded in 1967, the company maintains its primary operations in Jakarta, Indonesia, and functions as a subsidiary of Ooredoo Hutchison Asia Pte. Ltd.
株価
$0.09717104
時価総額
$3.13B
変化(1日)
0.00%
変化(1年)
-10.91%
国
ID
取引 PT Indosat Ooredoo Hutchison Tbk (ISAT)


カテゴリー
Communication Services
PT Indosat Ooredoo Hutchison Tbk(ISAT)のEPS
June 2026 時点のEPS TTM: $0.01
PT Indosat Ooredoo Hutchison Tbkの最新の財務報告と株価によると、同社の現在のEPS(TTM)は$0.01です。2024年末には、EPSは$0.01で、2023年のEPS$0.01と同等でした。
PT Indosat Ooredoo Hutchison TbkのEPS履歴(2000から2026まで)
各年末時点のEPS
| 年 | EPS | 変化 |
|---|---|---|
| 2026 (TTM) | $0.01 | 38.00% |
| 2025 | $0.01 | 8.51% |
| 2024 | $0.01 | 3.30% |
| 2023 | $0.01 | -4.21% |
| 2022 | $0.01 | -56.42% |
| 2021 | $0.02 | -1,138.10% |
| 2020 | 0.00 | -140.38% |
| 2019 | $0.01 | -168.42% |
| 2018 | $-0.01 | -294.87% |
| 2017 | 0.00 | 2.63% |
| 2016 | 0.00 | -186.36% |
| 2015 | 0.00 | -40.54% |
| 2014 | $-0.01 | -30.19% |
| 2013 | $-0.01 | -688.89% |
| 2012 | 0.00 | -65.38% |
| 2011 | $0.01 | 23.81% |
| 2010 | 0.00 | -42.47% |
| 2009 | $0.01 | -14.12% |
| 2008 | $0.01 | -15.00% |
| 2007 | $0.01 | 38.89% |
| 2006 | $0.01 | -7.69% |
| 2005 | $0.01 | -8.24% |
| 2004 | $0.01 | -4.49% |
| 2003 | $0.01 | 394.44% |
| 2002 | 0.00 | -73.91% |
| 2001 | $0.01 | -21.59% |
| 2000 | $0.01 | 0.00% |
同様の企業または競合他社のEPS
| 企業 | EPS | EPSの差 | 国 |
|---|---|---|---|
| - | - |
HK
|
|
| $3.84 | 27,726.09% |
US
|
|
| $9.58 | 69,320.29% |
US
|
|
| $3.03 | 21,856.52% |
US
|
|
| - | - |
DE
|


