


GATX Corporation
GATX
株式のランク
#3166
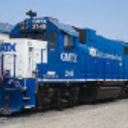
GATX Corporation, established in Chicago, Illinois in 1898, is a prominent... GATX Corporation, established in Chicago, Illinois in 1898, is a prominent global equipment lessor. The company primarily provides railcar and locomotive leasing services across North America and internationally, catering to vital industries such as petroleum, chemicals, food/agriculture, and transportation. Its operational framework is divided into three key segments: Rail North America, Rail International, and Portfolio Management. Beyond simply supplying equipment, GATX offers a comprehensive suite of support and maintenance services for its rail fleet. These include interior cleaning, routine upkeep and repairs to car bodies and safety features, ensuring regulatory compliance, facilitating wheelset replacements, performing interior blasting and lining, exterior painting, and applying car stenciling. Furthermore, GATX's activities extend to leasing aircraft spare engines (including units it directly owns) and managing a small collection of five liquefied gas-carrying vessels. The company also applies its expertise to overseeing asset portfolios on behalf of third parties. GATX maintains a substantial asset base, comprising approximately 147,000 railcars, a combined fleet of 568 locomotives (539 four-axle and 29 six-axle), and its five specialized vessels.
株価
$161.61
最終同期: 2026-10-20
時価総額
$5.71B
変化(1日)
-1.31%
変化(1年)
-0.86%
国
US
取引 GATX Corporation (GATX)


カテゴリー
Industrials
GATX Corporation(GATX)の発行済株式数
June 2026 時点の発行済株式数 35.70M
GATX Corporation の最新の財務報告および株価によると、現在の発行済株式数は 35.70M です。December 2023 の終わりには、同社は 35.70M 株の発行済株式 を有していました。発行済株式数は、通常、株式分割や自社株買いによって影響を受けます。
GATX Corporation(GATX)の発行済株式数の履歴(2000 ~ 2026)
各年末時点の発行済株式数
| 年 | 発行済株式数 | 変化 |
|---|---|---|
| 2026 (TTM) | 35.70M | -0.28% |
| 2024 | 35.80M | 0.28% |
| 2023 | 35.70M | 0.85% |
| 2022 | 35.40M | 0.00% |
| 2021 | 35.40M | 1.14% |
| 2020 | 35.00M | -1.96% |
| 2019 | 35.70M | -5.05% |
| 2018 | 37.60M | -3.09% |
| 2017 | 38.80M | -4.20% |
| 2016 | 40.50M | -6.03% |
| 2015 | 43.10M | -4.22% |
| 2014 | 45.00M | -3.02% |
| 2013 | 46.40M | -0.85% |
| 2012 | 46.80M | 0.86% |
| 2011 | 46.40M | 0.65% |
| 2010 | 46.10M | -1.50% |
| 2009 | 46.80M | -1.68% |
| 2008 | 47.60M | -4.61% |
| 2007 | 49.90M | -2.16% |
| 2006 | 51.00M | 1.79% |
| 2005 | 50.11M | 1.54% |
| 2004 | 49.35M | 0.54% |
| 2003 | 49.08M | 0.39% |
| 2002 | 48.89M | 0.66% |
| 2001 | 48.57M | 1.36% |
| 2000 | 47.91M | 0.00% |
類似企業や競合他社の発行済株式数
| 企業 | 発行済株式数 | 差 | 国 |
|---|---|---|---|
| 63.40M | 77.59% |
US
|
|
| - | - |
US
|
|
| 156.06M | 337.15% |
IE
|
|
| - | - |
BR
|
|
| 196.08M | 449.24% |
US
|


