


Mitsui O.S.K. Lines, Ltd.
9104
株式のランク
#1362
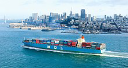
Mitsui O.S.K. Lines, Ltd., a global maritime transportation firm headquartered... Mitsui O.S.K. Lines, Ltd., a global maritime transportation firm headquartered in Tokyo, Japan, and founded in 1884, structures its extensive operations across Dry Bulk, Energy Transport, Product Transport, and various Associated Businesses. The company commands a vast and diverse fleet, including dry bulk carriers for commodities like iron ore, coal, grain, and steel products; a range of tankers for crude oil, refined petroleum (such as gas oils, naphtha, and gasoline), chemicals, methanol, and liquefied petroleum gas (LPG). Its vessels also encompass car carriers for passenger vehicles and construction machinery, containerships, as well as ferries and coastal RoRo ships. Beyond vessel operations, Mitsui O.S.K. Lines manages container terminals, floating storage and regasification units (FSRUs), and floating production, storage, and offloading (FPSO) systems. Its comprehensive logistics services include air and ocean freight forwarding, trucking, customs clearance, warehousing, inspection, heavyweight and oversized cargo transport, and buyers' consolidation. Additionally, the company maintains interests in a variety of ancillary maritime activities such as tugboat operations, land transport, maritime consulting, travel, office building leasing, property management, finance, trading, insurance, ICT systems, temporary staffing, oil stockpile project support, and nautical chart services. As of March 31, 2021, its impressive fleet tallied 268 dry bulkers; 280 tankers, LNG carriers, and steaming coal carriers; 60 containerships; a single cruise ship; 170 product transport vessels; and 2 other vessels.
株価
$47.05
時価総額
$16.17B
変化(1日)
-0.48%
変化(1年)
61.36%
国
JP
取引 Mitsui O.S.K. Lines, Ltd. (9104)


カテゴリー
Industrials
Mitsui O.S.K. Lines, Ltd.(9104)の営業利益率
2026 時点の営業利益率 TTM: 0.00%
Mitsui O.S.K. Lines, Ltd. の最新の財務報告と株価によると、現在の営業利益率(TTM)は 0.00% です。2026 年末時点では 0.00% でした。
Mitsui O.S.K. Lines, Ltd. の営業利益率の履歴(2026 から 2026)
各年末の営業利益率
| 年 | 営業利益率 | 変化 |
|---|---|---|
| 提供された日付のデータは十分ではありません。 | ||
同業他社の営業利益率
| 企業 | 営業利益率 | 営業利益率の差 | 国 |
|---|---|---|---|
| 0.00% | - |
KR
|
|
| 0.00% | - |
DK
|
|
| 44.33% | - |
IN
|
|
| 0.00% | - |
CN
|
|
| 0.00% | - |
PH
|


企業の営業利益率とは?
営業利益率は、企業の収益性を評価するための重要な指標です。高い営業利益率は一般的に良いとされており、企業が製品やサービスをその生産コストよりもはるかに高く販売できていることを示します。営業利益率は、企業の利益を売上高で割ることで計算されます。