


HMM Co.,Ltd
011200
株式のランク
#1443
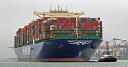
As a global, integrated logistics provider, HMM Co.,Ltd delivers comprehensive... As a global, integrated logistics provider, HMM Co.,Ltd delivers comprehensive shipping and freight forwarding solutions worldwide. The company facilitates the transport of a broad spectrum of goods, from vital bulk commodities like crude oil, coal, and iron ore, to specialized cargo and general import/export consignments. Its diverse fleet includes container ships, bulk carriers, various tankers (for crude oil and refined products), and trampers of different classes, such as Cape, Panamax, Supramax, and Handy vessels, alongside specialized heavy-lift and custom product carriers. Established in 1976, the company, originally known as Hyundai Merchant Marine Co.,Ltd, rebranded to HMM Co.,Ltd in March 2020. Its headquarters are situated in Seoul, South Korea.
株価
$16.15
時価総額
$15.23B
変化(1日)
-2.71%
変化(1年)
12.18%
国
KR
取引 HMM Co.,Ltd (011200)


カテゴリー
Industrials
HMM Co.,Ltd(011200)の営業利益率
October 2026 時点の営業利益率 TTM: 10.74%
HMM Co.,Ltd の最新の財務報告と株価によると、現在の営業利益率(TTM)は 10.74% です。2023 年末時点では 6.96% でした。
HMM Co.,Ltd の営業利益率の履歴(2007 から 2026)
各年末の営業利益率
| 年 | 営業利益率 | 変化 |
|---|---|---|
| 2026 (TTM) | 10.74% | -64.22% |
| 2024 | 30.02% | 331.32% |
| 2023 | 6.96% | -87.00% |
| 2022 | 53.55% | 0.13% |
| 2021 | 53.48% | 249.77% |
| 2020 | 15.29% | -427.41% |
| 2019 | -4.67% | -56.36% |
| 2018 | -10.70% | 32.26% |
| 2017 | -8.09% | -55.50% |
| 2016 | -18.18% | 313.18% |
| 2015 | -4.40% | 26.80% |
| 2014 | -3.47% | -14.11% |
| 2013 | -4.04% | -36.18% |
| 2012 | -6.33% | 13.24% |
| 2011 | -5.59% | -182.33% |
| 2010 | 6.79% | -181.71% |
| 2009 | -8.31% | -222.57% |
| 2008 | 6.78% | 13.76% |
| 2007 | 5.96% | 0.00% |
同業他社の営業利益率
| 企業 | 営業利益率 | 営業利益率の差 | 国 |
|---|---|---|---|
| 0.00% | - |
KR
|
|
| 0.00% | - |
DK
|
|
| 44.33% | -95.87% |
IN
|
|
| 0.00% | - |
CN
|
|
| 0.00% | - |
DE
|


企業の営業利益率とは?
営業利益率は、企業の収益性を評価するための重要な指標です。高い営業利益率は一般的に良いとされており、企業が製品やサービスをその生産コストよりもはるかに高く販売できていることを示します。営業利益率は、企業の利益を売上高で割ることで計算されます。