










Coin of the day
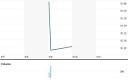
| Anno | Utile | Cambia |
|---|---|---|
| 2026 (TTM) | $-4.33M | -19.46% |
| 2024 | $-5.38M | -164.13% |
| 2023 | $8.39M | 9.43% |
| 2022 | $7.66M | -48.61% |
| 2021 | $14.91M | -805.43% |
| 2017 | $-2.11M | 769.96% |
| 2016 | $-243.00K | -48.73% |
| 2015 | $-474.00K | 0.00% |
| Azienda | Utile | Differenza negli utili | Il paese |
|---|---|---|---|
| - | - |
US
|
|
| - | - |
US
|
|
| - | - |
CN
|
|
| - | - |
US
|
|
| - | - |
US
|





