


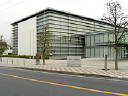
Kikkoman Corporation
2801
Classifica tra le azioni
#1914
Kikkoman Corporation, through its subsidiaries, engages in the manufacture and... Kikkoman Corporation, through its subsidiaries, engages in the manufacture and sale of food products in Japan and internationally. It offers soy sauce, soy sauce soup bases, and Del Monte seasonings; soy milk and Del Monte beverages; mirin and wines. The company also manufactures and sells canned fruits, corn products, and tomato ketchup; health foods; and purchases and sells oriental food products, as well as other products. In addition, it produces and sells clinical diagnostic enzymes, hygiene test agents, hyaluronic acid, as well as chemical products; and offers real estate rental, transportation, logistics, and warehousing services. The company was formerly known as Kikkoman Shoyu Co., Ltd. and changed its name to Kikkoman Corporation in 1980. Kikkoman Corporation was founded in 1917 and is headquartered in Noda, Japan.
Prezzo delle azioni
$11.94
Capitalizzazione di mercato
$11.06B
Variazione (1 giorno)
-0.73%
Variazione (1 anno)
40.73%
Paese
JP
Scambia Kikkoman Corporation (2801)


Categoria
Consumer Defensive
Ricavi di Kikkoman Corporation (2801)
Ricavi nel Jun 2026 TTM: $5.04B
Secondo gli ultimi rapporti finanziari di Kikkoman Corporation, i ricavi attuali dell'azienda (TTM) sono pari a $5.04B. Nel 2024, l'azienda ha registrato ricavi di $4.37B una diminuzione rispetto a i ricavi dell'anno 2023, che erano pari a $4.66B. I ricavi rappresentano l'importo totale generato dalla vendita di beni o servizi. A differenza degli utili, le spese non vengono detratte.
Storico dei ricavi per Kikkoman Corporation da 2006 a 2026
Ricavi alla fine di ogni anno
| Anno | Ricavi | Cambia |
|---|---|---|
| 2026 (TTM) | $5.04B | 6.48% |
| 2025 | $4.73B | 8.33% |
| 2024 | $4.37B | -6.33% |
| 2023 | $4.66B | 9.90% |
| 2022 | $4.24B | 6.91% |
| 2021 | $3.97B | -8.98% |
| 2020 | $4.36B | 6.67% |
| 2019 | $4.09B | 0.82% |
| 2018 | $4.05B | 12.24% |
| 2017 | $3.61B | -0.52% |
| 2016 | $3.63B | 17.23% |
| 2015 | $3.10B | -6.95% |
| 2014 | $3.33B | 4.44% |
| 2013 | $3.19B | -6.69% |
| 2012 | $3.41B | -0.17% |
| 2011 | $3.42B | 11.85% |
| 2010 | $3.06B | -27.09% |
| 2009 | $4.19B | 1.02% |
| 2008 | $4.15B | 24.73% |
| 2007 | $3.33B | 8.78% |
| 2006 | $3.06B | 0.00% |
Ricavi di aziende simili o concorrenti
| Azienda | Ricavi | Differenza nei ricavi | Il paese |
|---|---|---|---|
| $115.21B | 2,187.60% |
CH
|
|
| - | - |
FR
|
|
| - | - |
JP
|
|
| - | - |
BR
|
|
| $24.90B | 394.42% |
US
|


