


HMM Co.,Ltd
011200
Classifica tra le azioni
#1440
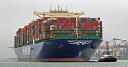
As a global, integrated logistics provider, HMM Co.,Ltd delivers comprehensive... As a global, integrated logistics provider, HMM Co.,Ltd delivers comprehensive shipping and freight forwarding solutions worldwide. The company facilitates the transport of a broad spectrum of goods, from vital bulk commodities like crude oil, coal, and iron ore, to specialized cargo and general import/export consignments. Its diverse fleet includes container ships, bulk carriers, various tankers (for crude oil and refined products), and trampers of different classes, such as Cape, Panamax, Supramax, and Handy vessels, alongside specialized heavy-lift and custom product carriers. Established in 1976, the company, originally known as Hyundai Merchant Marine Co.,Ltd, rebranded to HMM Co.,Ltd in March 2020. Its headquarters are situated in Seoul, South Korea.
Prezzo delle azioni
$16.15
Capitalizzazione di mercato
$15.23B
Variazione (1 giorno)
-0.43%
Variazione (1 anno)
14.44%
Paese
KR
Scambia HMM Co.,Ltd (011200)


Categoria
Industrials
Numero di azioni in circolazione per HMM Co.,Ltd (011200)
Numero di azioni in circolazione al June 2026: 943.24M
Secondo gli ultimi rapporti finanziari e il prezzo delle azioni di HMM Co.,Ltd, il numero attuale di azioni in circolazione è 943.24M. Alla fine del December 2023, la società aveva 581.02M azioni in circolazione. Il numero di azioni in circolazione è solitamente influenzato da split azionari e riacquisti.
Storico delle azioni in circolazione di HMM Co.,Ltd (011200) dal 2007 al 2026
Azioni in circolazione alla fine di ogni anno
| Anno | Azioni in circolazione | Cambia |
|---|---|---|
| 2026 (TTM) | 943.24M | 26.07% |
| 2024 | 748.20M | 28.77% |
| 2023 | 581.02M | 18.81% |
| 2022 | 489.04M | 26.03% |
| 2021 | 388.03M | 20.84% |
| 2020 | 321.11M | 65.61% |
| 2019 | 193.90M | 1.49% |
| 2018 | 191.05M | -0.24% |
| 2017 | 191.51M | 84.57% |
| 2016 | 103.76M | 225.99% |
| 2015 | 31.83M | 1.99% |
| 2014 | 31.21M | 22.24% |
| 2013 | 25.53M | 5.24% |
| 2012 | 24.26M | -2.51% |
| 2011 | 24.88M | 8.37% |
| 2010 | 22.96M | 6.33% |
| 2009 | 21.59M | -7.33% |
| 2008 | 23.30M | 3.43% |
| 2007 | 22.53M | 0.00% |
Azioni in circolazione per aziende simili o concorrenti
| Azienda | Azioni in circolazione | Differenza | Il paese |
|---|---|---|---|
| - | - |
KR
|
|
| - | - |
DK
|
|
| 2.30B | 144.32% |
IN
|
|
| - | - |
CN
|
|
| - | - |
DE
|


