


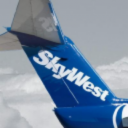
SkyWest, Inc.
SKYW
Peringkat dalam Saham
#4429
SkyWest, Inc. functions as a regional airline operator within the United... SkyWest, Inc. functions as a regional airline operator within the United States, managing its activities through various subsidiaries. The company organizes its business into two primary divisions: SkyWest Airlines and SkyWest Leasing. In addition to its aviation services, it also engages in leasing regional jet aircraft and spare engines to third-party clients. As of December 31, 2021, SkyWest's fleet consisted of 629 airplanes, facilitating approximately 2,080 daily scheduled departures for both passengers and cargo to destinations throughout the U.S., Canada, Mexico, and the Caribbean. The company further provides airport customer and ground handling support to other airlines. Incorporated in 1972, SkyWest, Inc. is headquartered in St. George, Utah.
Harga Saham
$90.17
Terakhir disinkronkan: 2026-10-19
Kapitalisasi Pasar
$3.50B
Perubahan (1 hari)
-1.46%
Perubahan (1 tahun)
-10.96%
Negara
US
Perdagangan SkyWest, Inc. (SKYW)


Kategori
Industrials
Riwayat dividen untuk SkyWest, Inc. (SKYW)
Saham SkyWest, Inc. (simbol: SKYW) telah membayar total 113 dividen.
Total semua dividen (disesuaikan dengan stock split): $3.85
Imbal hasil dividen (TTM): 0
Total semua dividen (disesuaikan dengan stock split): $3.85
Imbal hasil dividen (TTM): 0
Pembayaran dividen untuk SkyWest, Inc. (SKYW) dari 1986 hingga 2026
Pembayaran dividen tahunan
| Tahun | Dividen (disesuaikan dengan stock split) | Mengubah |
|---|---|---|
| 2026 (TTM) | $0.14 | 0.00% |
| 2020 | $0.14 | -70.83% |
| 2019 | $0.48 | 20.00% |
| 2018 | $0.4 | 25.00% |
| 2017 | $0.32 | 68.42% |
| 2016 | $0.19 | 18.75% |
| 2015 | $0.16 | -20.00% |
| 2014 | $0.2 | 25.00% |
| 2013 | $0.16 | 33.33% |
| 2012 | $0.12 | -25.00% |
| 2011 | $0.16 | 0.00% |
| 2010 | $0.16 | 0.06% |
| 2009 | $0.1599 | 23.38% |
| 2008 | $0.1296 | 8.36% |
| 2007 | $0.1196 | 0.00% |
| 2006 | $0.1196 | 0.00% |
| 2005 | $0.1196 | 0.00% |
| 2004 | $0.1196 | 50.25% |
| 2003 | $0.0796 | 0.00% |
| 2002 | $0.0796 | 0.00% |
| 2001 | $0.0796 | 0.00% |
| 2000 | $0.0796 | 51.62% |
| 1999 | $0.0525 | 82.93% |
| 1998 | $0.0287 | 15.73% |
| 1997 | $0.0248 | -13.59% |
| 1996 | $0.0287 | -8.01% |
| 1995 | $0.0312 | -10.60% |
| 1994 | $0.0349 | 86.63% |
| 1993 | $0.0187 | 179.10% |
| 1992 | $0.0067 | -5.63% |
| 1991 | $0.0071 | -53.90% |
| 1990 | $0.0154 | 27.27% |
| 1989 | $0.0121 | 61.33% |
| 1988 | $0.0075 | 158.62% |
| 1986 | $0.0029 | 0.00% |
Daftar semua pembayaran dividen
| Tahun | Dividen | Mengubah |
|---|---|---|
| 2026 (TTM) | $0.14 | 0.00% |
| 2020 | $0.14 | -70.83% |
| 2019 | $0.48 | 20.00% |
| 2018 | $0.4 | 25.00% |
| 2017 | $0.32 | 68.42% |
| 2016 | $0.19 | 18.75% |
| 2015 | $0.16 | -20.00% |
| 2014 | $0.2 | 25.00% |
| 2013 | $0.16 | 33.33% |
| 2012 | $0.12 | -25.00% |
| 2011 | $0.16 | 0.00% |
| 2010 | $0.16 | 0.00% |
| 2009 | $0.16 | 23.08% |
| 2008 | $0.13 | 8.33% |
| 2007 | $0.12 | 0.00% |
| 2006 | $0.12 | 0.00% |
| 2005 | $0.12 | 0.00% |
| 2004 | $0.12 | 50.00% |
| 2003 | $0.08 | 0.00% |
| 2002 | $0.08 | 0.00% |
| 2001 | $0.08 | -42.86% |
| 2000 | $0.14 | 16.67% |
| 1999 | $0.12 | -14.29% |
| 1998 | $0.14 | -30.00% |
| 1997 | $0.2 | 11.11% |
| 1996 | $0.18 | -28.00% |
| 1995 | $0.25 | -10.71% |
| 1994 | $0.28 | 86.67% |
| 1993 | $0.15 | 87.50% |
| 1992 | $0.08 | -5.88% |
| 1991 | $0.085 | -54.05% |
| 1990 | $0.185 | 27.59% |
| 1989 | $0.145 | 61.11% |
| 1988 | $0.09 | 157.14% |
| 1986 | $0.035 | 0.00% |
Pembayaran dividen untuk perusahaan sejenis atau pesaing
| Perusahaan | Jumlah pembayaran dividen | Negara |
|---|---|---|
| 38.00% |
US
|
|
| 0.00% |
ES
|
|
| 1.00% |
US
|
|
| 0.00% |
IE
|
|
| 0.00% |
TH
|


