


China Railway Construction Heavy Industry Corporation Limited
688425
Peringkat dalam Saham
#4659
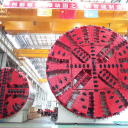
China Railway Construction Heavy Industry Corporation Limited (CRCHI) is a... China Railway Construction Heavy Industry Corporation Limited (CRCHI) is a prominent global manufacturer specializing in equipment for the underground construction and rail transit industries. The company's core product offerings include heavy machinery such as tunnel boring machines (TBMs), shaft-boring machines, drilling jumbos, and concrete sprayers. It also supplies specialized tunnel vehicles for lifting and installation tasks, along with critical rail infrastructure components like railway turnouts, clips, and fasteners. CRCHI further diversifies its product range to encompass New Austrian Tunneling Method (NATM) equipment, comprehensive rail track and maglev systems, various railway transit solutions, agricultural machinery, green building construction tools, coal mine equipment, and general construction materials. Beyond products, the company delivers a full suite of services, including design, fabrication, training, on-site support, equipment refurbishment, and spare parts provision. Established in 2007, CRCHI maintains its headquarters in Changsha, China, operating as a subsidiary under the umbrella of China Railway Construction Corporation Limited.
Harga Saham
$0.60047469
Kapitalisasi Pasar
$3.20B
Perubahan (1 hari)
0.50%
Perubahan (1 tahun)
-25.58%
Negara
CN
Perdagangan China Railway Construction Heavy Industry Corporation Limited (688425)


Kategori
Industrials
Rasio P/E untuk China Railway Construction Heavy Industry Corporation Limited (688425)
Rasio P/E per October 2026 TTM: 17.09
Menurut laporan keuangan dan harga saham terbaru dari China Railway Construction Heavy Industry Corporation Limited, rasio P/E saat ini (TTM) adalah 17.09. Pada akhir 2024, perusahaan memiliki rasio P/E sebesar 15.71.
Riwayat rasio P/E untuk China Railway Construction Heavy Industry Corporation Limited dari 2017 hingga 2026
Rasio P/E di akhir setiap tahun
| Tahun | Rasio P/E | Mengubah |
|---|---|---|
| 2026 (TTM) | 17.09 | -5.66% |
| 2025 | 18.11 | 15.23% |
| 2024 | 15.71 | 18.45% |
| 2023 | 13.27 | 17.55% |
| 2022 | 11.29 | -15.62% |
| 2021 | 13.38 | -33.29% |
| 2020 | 20.05 | -2.44% |
| 2019 | 20.55 | 0.00% |
| 2018 | 0.00 | 0.00% |
| 2017 | 0.00 | 0.00% |
Rasio P/E untuk perusahaan serupa atau pesaing
| Perusahaan | Rasio P/E | Perbedaan Rasio P/E | Negara |
|---|---|---|---|
| 35.44 | 107.42% |
US
|
|
| 24.92 | 45.87% |
DE
|
|
| 28.00 | 63.87% |
FR
|
|
| 40.86 | 139.13% |
DE
|
|
| 30.90 | 80.85% |
US
|


Bagaimana cara membaca P/E ratio?
Rasio Harga/Laba (P/E) mengukur hubungan antara harga saham perusahaan dan laba per sahamnya.
P/E yang rendah namun positif menunjukkan perusahaan dengan laba tinggi dibandingkan valuasinya saat ini dan mungkin dianggap undervalued. P/E negatif tinggi (mendekati 0) menunjukkan perusahaan yang mengalami kerugian besar.
Perusahaan dengan P/E di atas 30 atau negatif umumnya dianggap sebagai "saham pertumbuhan", artinya investor mengharapkan pertumbuhan atau keuntungan di masa depan.
Perusahaan dengan P/E positif di bawah 10 dianggap sebagai "saham bernilai", artinya perusahaan sudah sangat menguntungkan dan pertumbuhannya kemungkinan tidak besar.