


HMM Co.,Ltd
011200
Helyezés a részvények között
#1444
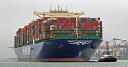
As a global, integrated logistics provider, HMM Co.,Ltd delivers comprehensive... As a global, integrated logistics provider, HMM Co.,Ltd delivers comprehensive shipping and freight forwarding solutions worldwide. The company facilitates the transport of a broad spectrum of goods, from vital bulk commodities like crude oil, coal, and iron ore, to specialized cargo and general import/export consignments. Its diverse fleet includes container ships, bulk carriers, various tankers (for crude oil and refined products), and trampers of different classes, such as Cape, Panamax, Supramax, and Handy vessels, alongside specialized heavy-lift and custom product carriers. Established in 1976, the company, originally known as Hyundai Merchant Marine Co.,Ltd, rebranded to HMM Co.,Ltd in March 2020. Its headquarters are situated in Seoul, South Korea.
Részvényárfolyam
$16.15
Piaci kapitalizáció
$15.23B
Változás (1 nap)
-0.43%
Változás (1 év)
14.44%
Ország
KR
Kereskedés HMM Co.,Ltd (011200)


Kategória
Industrials
HMM Co.,Ltd (011200) nyeresége
Nyereség ekkor: Jun 2026 TTM: $1.07B
HMM Co.,Ltd legfrissebb pénzügyi jelentései szerint a vállalat jelenlegi nyeresége $1.07B. 2023 évben a vállalat $814.40M nyereséget ért el, csökkenés a 2022 év nyereségéhez, amely $8.07B volt. Az ezen az oldalon megjelenített nyereség a kamatok és adók előtti eredmény, azaz EBIT.
HMM Co.,Ltd nyereségtörténete 2007 és 2026 között
Nyereség az év végén
| Év | Nyereség | Változtassa meg |
|---|---|---|
| 2026 (TTM) | $1.07B | -59.51% |
| 2024 | $2.65B | 225.44% |
| 2023 | $814.40M | -89.91% |
| 2022 | $8.07B | 80.10% |
| 2021 | $4.48B | 3,706.68% |
| 2020 | $117.71M | -123.17% |
| 2019 | $-508.09M | -27.36% |
| 2018 | $-699.50M | -37.20% |
| 2017 | $-1.11B | 223.24% |
| 2016 | $-344.56M | -40.82% |
| 2015 | $-582.24M | 36.98% |
| 2014 | $-425.05M | -35.10% |
| 2013 | $-654.96M | -28.07% |
| 2012 | $-910.56M | 106.88% |
| 2011 | $-440.15M | -243.02% |
| 2010 | $307.75M | -143.07% |
| 2009 | $-714.52M | -253.73% |
| 2008 | $464.79M | 96.74% |
| 2007 | $236.24M | 0.00% |
Hasonló cégek vagy versenytársak nyeresége
| Vállalat | Nyereség | Nyereségkülönbség | Ország |
|---|---|---|---|
| - | - |
KR
|
|
| - | - |
DK
|
|
| $1.69B | 57.41% |
IN
|
|
| - | - |
CN
|
|
| - | - |
PH
|


