









Top Markets
Coin of the day
Textainer Group Holdings Limited Textainer Group Holdings Limited

Textainer Group Holdings Limited

TGH
Classement en actions #6382
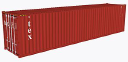
Textainer Group Holdings Limited (TGH), established in 1979 and headquartered... Textainer Group Holdings Limited (TGH), established in 1979 and headquartered in Hamilton, Bermuda, is a prominent global entity engaged in the full lifecycle management of intermodal containers. The company's operations span the acquisition, ownership, administration, rental, and ultimate sale of a vast array of shipping containers. Its business is structured around three key areas: direct container ownership, overseeing container portfolios for others, and the resale of containers. Textainer boasts an extensive fleet, comprising approximately 2.7 million units, which translates to 4.3 million twenty-foot equivalent units (TEUs). This diverse inventory includes standard and specialized dry freight containers, refrigerated units, and a variety of unique purpose containers such as tank, 45-foot, and pallet-wide types. Beyond managing its own fleet, the company also delivers comprehensive container management, procurement, and disposition services to both affiliated and independent container investment groups. Furthermore, TGH actively sells containers from its existing stock and participates in the purchase, leasing, or resale of units acquired from shipping lines, container traders, and other market suppliers. Its primary clientele consists of major shipping companies, freight forwarding enterprises, and the United States military.
Prix de l'action
$49.99
Dernière synchronisation: 2024-03-13
Capitalisation boursière
$2.07B
Changement (1 jour)
0.04%
Changement (1 an)
0.00%
Pays
BM
Échange Textainer Group Holdings Limited (TGH)

Catégorie

Ratio P/E pour Textainer Group Holdings Limited (TGH)
Ratio P/E au 2026 TTM : 0
Selon les derniers rapports financiers et le cours de l'action de Textainer Group Holdings Limited, le ratio P/E actuel (TTM) est de 0. À la fin de l’année 2026, le P/E de l’entreprise était de 0.
Historique du ratio P/E pour Textainer Group Holdings Limited de 2026 à 2026
Ratio P/E à la fin de chaque année
Année Ratio P/E Changez
Pas assez de données pour les dates fournies.
Ratio P/E pour des entreprises similaires ou concurrentes
Entreprise P/E Ratio Différence du P/E Ratio Pays
27.83 -
US
- -
US
7.38 -
IE
390.58 -
US
9.88 -
FR
Comment lire un P/E ratio ?

Le ratio Prix/Bénéfice (P/E Ratio) mesure la relation entre le cours de l'action d'une entreprise et ses bénéfices par action.
Un P/E bas mais positif indique une entreprise qui génère des bénéfices élevés par rapport à sa valorisation et qui pourrait être sous-évaluée. Un P/E négatif élevé (proche de 0) indique des pertes importantes.

Les entreprises avec un P/E supérieur à 30 ou négatif sont généralement considérées comme des "actions de croissance", ce qui signifie que les investisseurs s'attendent à ce qu'elles se développent ou deviennent rentables.

Les entreprises avec un P/E positif inférieur à 10 sont généralement considérées comme des "actions de valeur", car elles sont déjà très rentables mais avec peu de potentiel de croissance.


