


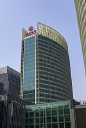
Bank of Beijing Co., Ltd.
601169
Classement en actions
#1272
Bank of Beijing Co., Ltd. is a subsidiary entity within Taikang Insurance Group... Bank of Beijing Co., Ltd. is a subsidiary entity within Taikang Insurance Group Inc.
Prix de l'action
$0.82509115
Capitalisation boursière
$17.44B
Changement (1 jour)
-1.61%
Changement (1 an)
2.26%
Pays
CN
Échange Bank of Beijing Co., Ltd. (601169)


Catégorie
Financial Services
Ratio P/B pour Bank of Beijing Co., Ltd. (601169)
Ratio P/B au October 2026 TTM : 0.39
Selon les derniers rapports financiers et le cours de l'action de Bank of Beijing Co., Ltd., le ratio cours/valeur comptable actuel (TTM) est 0.39. À la fin de 2024, le ratio P/B était de 0.42.
Historique du ratio P/B pour Bank of Beijing Co., Ltd. de 2004 à 2026
Ratio P/B à la fin de chaque année
| Année | Ratio P/B | Changez |
|---|---|---|
| 2026 (TTM) | 0.39 | -20.22% |
| 2025 | 0.49 | 18.13% |
| 2024 | 0.42 | 1.34% |
| 2023 | 0.41 | 39.18% |
| 2022 | 0.29 | -7.35% |
| 2021 | 0.32 | -31.70% |
| 2020 | 0.47 | -19.48% |
| 2019 | 0.58 | -4.91% |
| 2018 | 0.61 | -18.58% |
| 2017 | 0.75 | -28.40% |
| 2016 | 1.04 | -8.58% |
| 2015 | 1.14 | -5.42% |
| 2014 | 1.21 | 42.71% |
| 2013 | 0.85 | -23.09% |
| 2012 | 1.10 | -3.91% |
| 2011 | 1.14 | -31.84% |
| 2010 | 1.68 | -47.89% |
| 2009 | 3.22 | 96.33% |
| 2008 | 1.64 | -60.97% |
| 2007 | 4.21 | -63.33% |
| 2006 | 11.47 | 1.19% |
| 2005 | 11.33 | -48.53% |
| 2004 | 22.02 | 0.00% |
Ratio P/B pour des entreprises similaires ou concurrentes
| Entreprise | Ratio P/B | Différence de Ratio P/B | Pays |
|---|---|---|---|
| 0.9211 | 135.64% |
CN
|
|
| - | - |
IT
|
|
| 1.6216 | 314.84% |
JP
|
|
| - | - |
IN
|
|
| - | - |
PH
|


