


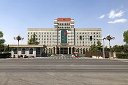
Beijing Yanjing Brewery Co.,Ltd.
000729
Classement en actions
#3623
Beijing Yanjing Brewery Co.,Ltd., based in Beijing, People's Republic of China,... Beijing Yanjing Brewery Co.,Ltd., based in Beijing, People's Republic of China, is a company primarily engaged in the production and sale of beer across both domestic and international markets. Founded in 1980, the firm also expands its product line to include various other beverages, such as mineral water. It operated under the name Shunyi County Brewery before officially changing to Beijing Yanjing Brewery Co.,Ltd. in March 1984.
Prix de l'action
$1.66
Capitalisation boursière
$4.67B
Changement (1 jour)
1.95%
Changement (1 an)
-0.95%
Pays
CN
Échange Beijing Yanjing Brewery Co.,Ltd. (000729)


Catégorie
Consumer Defensive
Bénéfices pour Beijing Yanjing Brewery Co.,Ltd. (000729)
Bénéfices en Jun 2026 TTM : $408.62M
Selon les derniers rapports financiers de Beijing Yanjing Brewery Co.,Ltd., les bénéfices actuels de l'entreprise sont de $408.62M. En 2023, l'entreprise a réalisé un bénéfice de $146.79M, une augmentation par rapport à celui de 2022 qui était de $100.70M. Les bénéfices affichés sur cette page correspondent aux bénéfices avant intérêts et impôts, appelés aussi EBIT.
Historique des bénéfices pour Beijing Yanjing Brewery Co.,Ltd. de 2000 à 2026
Bénéfices à la fin de chaque année
| Année | Bénéfices | Changez |
|---|---|---|
| 2026 (TTM) | $408.62M | 89.77% |
| 2024 | $215.33M | 46.69% |
| 2023 | $146.79M | 45.77% |
| 2022 | $100.70M | 43.97% |
| 2021 | $69.95M | -0.74% |
| 2020 | $70.47M | 16.35% |
| 2019 | $60.57M | 9.32% |
| 2018 | $55.40M | 0.64% |
| 2017 | $55.05M | -25.64% |
| 2016 | $74.03M | -42.78% |
| 2015 | $129.39M | -23.59% |
| 2014 | $169.33M | 1.12% |
| 2013 | $167.45M | 22.06% |
| 2012 | $137.19M | -27.20% |
| 2011 | $188.45M | 14.33% |
| 2010 | $164.82M | 21.21% |
| 2009 | $135.98M | 44.55% |
| 2008 | $94.07M | 18.74% |
| 2007 | $79.22M | 41.72% |
| 2006 | $55.90M | 19.37% |
| 2005 | $46.83M | -0.88% |
| 2004 | $47.25M | 15.86% |
| 2003 | $40.78M | 43.38% |
| 2002 | $28.44M | -26.00% |
| 2001 | $38.43M | 2.91% |
| 2000 | $37.35M | 0.00% |
Bénéfices des entreprises similaires ou concurrentes
| Entreprise | Bénéfices | Différence de bénéfices | Pays |
|---|---|---|---|
| - | - |
CN
|
|
| - | - |
BE
|
|
| - | - |
MX
|
|
| - | - |
BR
|
|
| - | - |
NL
|


