









Top Markets
Coin of the day
Crossject Société Anonyme Crossject Société Anonyme

Crossject Société Anonyme

ALCJ
Clasificación en acciones #12697
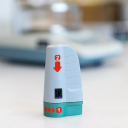
Crossject Société Anonyme develops needle-free injection systems. The company... Crossject Société Anonyme develops needle-free injection systems. The company develops ZENEO, a needle-free, prefilled, and single-use auto-injector. Its clinical stage drugs comprise Sumatriptan, which is used for of treatment migraines and cluster headaches; Adrenaline for treating anaphylactic shock; Hydrocortisone that is used for treatment of acute adrenal crisis; Midazolam for treating epileptic seizure; Naloxone used for treatment of overdose; Apomorphine, for treating temporary paralysis in parkinson's disease; Methotrexate used for treatment of rheumatoid arthritis; and Terbutaline, for treating severe asthma crisis. The company was founded in 1997 and is based in Dijon, France.
Precio por acción
$2.04
Capitalización bursátil
$122.58M
Cambio (1 día)
4.48%
Cambio (1 año)
-1.05%
País
FR
Comercio Crossject Société Anonyme (ALCJ)

Categoría

Ganancias de Crossject Société Anonyme (ALCJ)
Ganancias en Dec 2025 TTM: $-15.47M
Secondo gli ultimi rapporti finanziari di Crossject Société Anonyme, gli utili attuali della società sono $-15.47M. Nel 2023, la società ha registrato un utile di $-12.72M, un aumento con respecto a agli utili del 2022, che erano di $-14.35M. Gli utili mostrati in questa pagina sono quelli prima degli interessi e delle imposte, ovvero EBIT.
Historial de ganancias de Crossject Société Anonyme desde 2010 hasta 2026
Ganancias al final de cada año
Año Ganancias Cambiar
2026 (TTM) $-15.47M -4.84%
2024 $-16.25M 27.80%
2023 $-12.72M -11.38%
2022 $-14.35M -0.03%
2021 $-14.36M 2.59%
2020 $-13.99M 46.56%
2019 $-9.55M -32.47%
2018 $-14.14M 34.82%
2017 $-10.49M 28.48%
2016 $-8.16M 11.67%
2015 $-7.31M 13.90%
2014 $-6.42M 95.21%
2013 $-3.29M 78.49%
2012 $-1.84M -292.97%
2011 $954.59K -114.97%
2010 $-6.38M 0.00%
Ganancias de empresas similares o competidoras
Empresa Ganancias Diferencia de ganancias País
$3.58B -23,265.34%
US
$3.75B -24,333.92%
FR
$414.52M -2,779.78%
DE
$2.17B -14,118.05%
JP
$1.74B -11,342.30%
US



