


China Railway Construction Heavy Industry Corporation Limited
688425
Clasificación en acciones
#4655
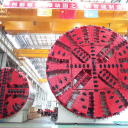
China Railway Construction Heavy Industry Corporation Limited (CRCHI) is a... China Railway Construction Heavy Industry Corporation Limited (CRCHI) is a prominent global manufacturer specializing in equipment for the underground construction and rail transit industries. The company's core product offerings include heavy machinery such as tunnel boring machines (TBMs), shaft-boring machines, drilling jumbos, and concrete sprayers. It also supplies specialized tunnel vehicles for lifting and installation tasks, along with critical rail infrastructure components like railway turnouts, clips, and fasteners. CRCHI further diversifies its product range to encompass New Austrian Tunneling Method (NATM) equipment, comprehensive rail track and maglev systems, various railway transit solutions, agricultural machinery, green building construction tools, coal mine equipment, and general construction materials. Beyond products, the company delivers a full suite of services, including design, fabrication, training, on-site support, equipment refurbishment, and spare parts provision. Established in 2007, CRCHI maintains its headquarters in Changsha, China, operating as a subsidiary under the umbrella of China Railway Construction Corporation Limited.
Precio por acción
$0.60047469
Capitalización bursátil
$3.20B
Cambio (1 día)
0.50%
Cambio (1 año)
-25.58%
País
CN
Comercio China Railway Construction Heavy Industry Corporation Limited (688425)


Categoría
Industrials
Margen Operativo de China Railway Construction Heavy Industry Corporation Limited (688425)
Margen Operativo al October 2026 TTM: 14.19%
Según los informes financieros más recientes y el precio de las acciones de China Railway Construction Heavy Industry Corporation Limited, el margen operativo actual (TTM) es 14.19%. Al final de 2024, el margen operativo era 16.46%.
Historial de Margen Operativo de China Railway Construction Heavy Industry Corporation Limited desde 2017 hasta 2026
Margen Operativo al final de cada año
| Año | Margen Operativo | Cambiar |
|---|---|---|
| 2026 (TTM) | 14.19% | -14.47% |
| 2025 | 16.59% | 0.79% |
| 2024 | 16.46% | -5.40% |
| 2023 | 17.40% | -12.87% |
| 2022 | 19.97% | -1.29% |
| 2021 | 20.23% | -13.06% |
| 2020 | 23.27% | -1.15% |
| 2019 | 23.54% | -1.18% |
| 2018 | 23.82% | 18.80% |
| 2017 | 20.05% | 0.00% |
Margen Operativo de empresas similares o competidoras
| Empresa | Margen Operativo | Diferencia de Margen Operativo | País |
|---|---|---|---|
| 0.00% | - |
US
|
|
| 11.89% | -99.16% |
DE
|
|
| 0.00% | - |
FR
|
|
| 8.81% | -99.38% |
DE
|
|
| 21.55% | -98.48% |
US
|


¿Qué es el Margen Operativo de una empresa?
El Margen Operativo es un indicador clave para evaluar la rentabilidad de una empresa. Un margen operativo más alto suele ser mejor, ya que indica que una empresa puede vender sus productos o servicios por mucho más de lo que cuestan producirlos. Se calcula dividiendo las ganancias de la empresa entre sus ingresos.