


HMM Co.,Ltd
011200
Clasificación en acciones
#1444
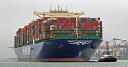
As a global, integrated logistics provider, HMM Co.,Ltd delivers comprehensive... As a global, integrated logistics provider, HMM Co.,Ltd delivers comprehensive shipping and freight forwarding solutions worldwide. The company facilitates the transport of a broad spectrum of goods, from vital bulk commodities like crude oil, coal, and iron ore, to specialized cargo and general import/export consignments. Its diverse fleet includes container ships, bulk carriers, various tankers (for crude oil and refined products), and trampers of different classes, such as Cape, Panamax, Supramax, and Handy vessels, alongside specialized heavy-lift and custom product carriers. Established in 1976, the company, originally known as Hyundai Merchant Marine Co.,Ltd, rebranded to HMM Co.,Ltd in March 2020. Its headquarters are situated in Seoul, South Korea.
Precio por acción
$16.15
Capitalización bursátil
$15.23B
Cambio (1 día)
-0.43%
Cambio (1 año)
14.44%
País
KR
Comercio HMM Co.,Ltd (011200)


Categoría
Industrials
Ganancias de HMM Co.,Ltd (011200)
Ganancias en Jun 2026 TTM: $1.07B
Secondo gli ultimi rapporti finanziari di HMM Co.,Ltd, gli utili attuali della società sono $1.07B. Nel 2023, la società ha registrato un utile di $814.40M, una disminución en comparación con agli utili del 2022, che erano di $8.07B. Gli utili mostrati in questa pagina sono quelli prima degli interessi e delle imposte, ovvero EBIT.
Historial de ganancias de HMM Co.,Ltd desde 2007 hasta 2026
Ganancias al final de cada año
| Año | Ganancias | Cambiar |
|---|---|---|
| 2026 (TTM) | $1.07B | -59.51% |
| 2024 | $2.65B | 225.44% |
| 2023 | $814.40M | -89.91% |
| 2022 | $8.07B | 80.10% |
| 2021 | $4.48B | 3,706.68% |
| 2020 | $117.71M | -123.17% |
| 2019 | $-508.09M | -27.36% |
| 2018 | $-699.50M | -37.20% |
| 2017 | $-1.11B | 223.24% |
| 2016 | $-344.56M | -40.82% |
| 2015 | $-582.24M | 36.98% |
| 2014 | $-425.05M | -35.10% |
| 2013 | $-654.96M | -28.07% |
| 2012 | $-910.56M | 106.88% |
| 2011 | $-440.15M | -243.02% |
| 2010 | $307.75M | -143.07% |
| 2009 | $-714.52M | -253.73% |
| 2008 | $464.79M | 96.74% |
| 2007 | $236.24M | 0.00% |
Ganancias de empresas similares o competidoras
| Empresa | Ganancias | Diferencia de ganancias | País |
|---|---|---|---|
| - | - |
KR
|
|
| - | - |
DK
|
|
| $1.69B | 57.41% |
IN
|
|
| - | - |
CN
|
|
| - | - |
PH
|


