


The Vita Coco Company, Inc.
COCO
Rang in Aktien
#4528
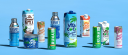
The Vita Coco Company, Inc. is a global beverage enterprise, founded in New... The Vita Coco Company, Inc. is a global beverage enterprise, founded in New York in 2004, primarily engaged in the development, marketing, and distribution of its flagship Vita Coco-branded coconut water. Its extensive market presence spans the United States, Canada, Europe, the Middle East, and the Asia Pacific region. Beyond its core product, the company's diverse portfolio encompasses coconut oil and milk, Hydration Drink Mix (a powdered flavored coconut water), sparkling water, the plant-based energy drink Runa, purified water under the Ever & Ever label, and PWR LIFT, a protein-enhanced fitness beverage. The firm leverages a broad distribution network, reaching consumers through club stores, grocery chains, pharmacies, mass merchandisers, convenience stores, online channels, and foodservice providers. Furthermore, Vita Coco acts as a wholesale supplier of coconut water and coconut oil categories to other retailers. Originally known as All Market Inc., the company officially adopted The Vita Coco Company, Inc. as its name in September 2021.
Aktienkurs
$59.16
Zuletzt synchronisiert: 2026-10-16
Marktkapitalisierung
$3.40B
Veränderung (1 Tag)
2.58%
Veränderung (1 Jahr)
44.43%
Land
US
Handel The Vita Coco Company, Inc. (COCO)


Kategorie
Consumer Defensive
Gewinn für The Vita Coco Company, Inc. (COCO)
Gewinn im Jun 2026 TTM: $142.24M
Laut den aktuellen Finanzberichten von The Vita Coco Company, Inc. betragen die aktuellen Gewinne des Unternehmens $142.24M. Im Jahr 2023 erzielte das Unternehmen einen Gewinn von $57.92M, eine Steigerung gegenüber dem Gewinn im Jahr 2022, der $10.84M betrug. Die auf dieser Seite angezeigten Gewinne sind die Gewinne vor Zinsen und Steuern, auch bekannt als EBIT.
Gewinnverlauf von The Vita Coco Company, Inc. von 2019 bis 2026
Gewinn am Ende jedes Jahres
| Jahr | Gewinn | ändert |
|---|---|---|
| 2026 (TTM) | $142.24M | 100.93% |
| 2024 | $70.79M | 22.22% |
| 2023 | $57.92M | 434.27% |
| 2022 | $10.84M | -55.26% |
| 2021 | $24.23M | -44.43% |
| 2020 | $43.60M | 282.42% |
| 2019 | $11.40M | 0.00% |
Gewinn ähnlicher Unternehmen oder Konkurrenten
| Unternehmen | Gewinn | Gewinnunterschied | Land |
|---|---|---|---|
| $17.23B | 12,014.37% |
US
|
|
| $13.73B | 9,550.16% |
US
|
|
| $2.78B | 1,851.84% |
US
|
|
| $3.25B | 2,188.19% |
CN
|
|
| $1.97B | 1,285.73% |
US
|


