


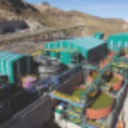
Compañía de Minas Buenaventura S.A.A.
BVN
Rang in Aktien
#2504
Compañía de Minas Buenaventura S.A.A. is a prominent Peruvian mining company... Compañía de Minas Buenaventura S.A.A. is a prominent Peruvian mining company focused on the exploration, development, processing, and commercialization of both precious and base metals. Its primary targets for extraction include gold, silver, lead, zinc, and copper. The company operates several key mining units within Peru, such as Tambomayo (Caylloma province), Orcopampa (Castilla province), Uchucchacua (Oyón province), and Julcani (Angaraes province). It also manages the San Gabriel project in the General Sánchez Cerro province, Moquegua region. Furthermore, Buenaventura holds significant interests in other notable mines, including Colquijirca, La Zanja, Yanacocha, Cerro Verde, El Brocal, Coimolache, Yumpaq, San Gregorio, and the Trapiche mining unit. Diversifying its operations, the company also produces manganese sulphate monohydrate and other mineral by-products, in addition to operating hydroelectric power plants. Established in 1953, Compañía de Minas Buenaventura S.A.A. is headquartered in Lima, Peru.
Aktienkurs
$30.47
Zuletzt synchronisiert: 2026-10-16
Marktkapitalisierung
$7.74B
Veränderung (1 Tag)
-2.21%
Veränderung (1 Jahr)
19.16%
Land
PE
Handel Compañía de Minas Buenaventura S.A.A. (BVN)


Kategorie
Basic Materials
Operative Marge für Compañía de Minas Buenaventura S.A.A. (BVN)
Operative Marge zum October 2026 TTM: 41.67%
Laut den neuesten Finanzberichten und dem Aktienkurs von Compañía de Minas Buenaventura S.A.A. beträgt die aktuelle operative Marge (TTM) 41.67%. Am Ende des Jahres 2023 lag die operative Marge bei 2.56%.
Historie der operativen Marge von Compañía de Minas Buenaventura S.A.A. von 2000 bis 2026
Operative Marge zum Jahresende
| Jahr | Operative Marge | ändert |
|---|---|---|
| 2026 (TTM) | 41.67% | 7.95% |
| 2024 | 38.60% | 1,407.81% |
| 2023 | 2.56% | -83.98% |
| 2022 | 15.98% | -27.50% |
| 2021 | 22.04% | -300.36% |
| 2020 | -11.00% | 3,974.07% |
| 2019 | -0.27% | -105.87% |
| 2018 | 4.60% | -44.44% |
| 2017 | 8.28% | -33.06% |
| 2016 | 12.37% | -179.75% |
| 2015 | -15.51% | -393.19% |
| 2014 | 5.29% | -48.59% |
| 2013 | 10.29% | -61.53% |
| 2012 | 26.75% | -40.95% |
| 2011 | 45.30% | 14.28% |
| 2010 | 39.64% | 21.67% |
| 2009 | 32.58% | -6.38% |
| 2008 | 34.80% | 51.90% |
| 2007 | 22.91% | -51.06% |
| 2006 | 46.81% | 67.90% |
| 2005 | 27.88% | -2.04% |
| 2004 | 28.46% | 37.22% |
| 2003 | 20.74% | -1.52% |
| 2002 | 21.06% | 136.63% |
| 2001 | 8.90% | 179.87% |
| 2000 | 3.18% | 0.00% |
Operative Marge vergleichbarer Unternehmen oder Wettbewerber
| Unternehmen | Operative Marge | Differenz der operativen Marge | Land |
|---|---|---|---|
| 0.00% | - |
RU
|
|
| 0.00% | - |
MX
|
|
| 0.00% | - |
SE
|
|
| 0.00% | - |
ID
|
|
| 0.00% | - |
CA
|


Was ist die operative Marge eines Unternehmens?
Die operative Marge ist ein wichtiger Indikator zur Bewertung der Rentabilität eines Unternehmens. Höhere operative Margen sind in der Regel besser, da sie zeigen, dass ein Unternehmen seine Produkte oder Dienstleistungen mit deutlichem Gewinn über den Produktionskosten verkauft. Die operative Marge wird berechnet, indem der Gewinn des Unternehmens durch seinen Umsatz geteilt wird.