


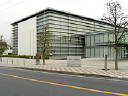
Kikkoman Corporation
2801
Rang in Aktien
#1919
Kikkoman Corporation, through its subsidiaries, engages in the manufacture and... Kikkoman Corporation, through its subsidiaries, engages in the manufacture and sale of food products in Japan and internationally. It offers soy sauce, soy sauce soup bases, and Del Monte seasonings; soy milk and Del Monte beverages; mirin and wines. The company also manufactures and sells canned fruits, corn products, and tomato ketchup; health foods; and purchases and sells oriental food products, as well as other products. In addition, it produces and sells clinical diagnostic enzymes, hygiene test agents, hyaluronic acid, as well as chemical products; and offers real estate rental, transportation, logistics, and warehousing services. The company was formerly known as Kikkoman Shoyu Co., Ltd. and changed its name to Kikkoman Corporation in 1980. Kikkoman Corporation was founded in 1917 and is headquartered in Noda, Japan.
Aktienkurs
$11.91
Marktkapitalisierung
$11.04B
Veränderung (1 Tag)
0.69%
Veränderung (1 Jahr)
39.01%
Land
JP
Handel Kikkoman Corporation (2801)


Kategorie
Consumer Defensive
EPS für Kikkoman Corporation (2801)
EPS zum June 2026 TTM: $0.46
Laut den aktuellen Finanzberichten und dem Aktienkurs von Kikkoman Corporation beträgt das aktuelle EPS des Unternehmens (TTM) $0.46. Am Ende des Jahres 2024 betrug das EPS $0.39 eine Steigerung gegenüber dem EPS von 2023, das $0.34 betrug.
EPS-Verlauf von Kikkoman Corporation von 2006 bis 2026
EPS am Ende jedes Jahres
| Jahr | EPS | ändert |
|---|---|---|
| 2026 (TTM) | $0.46 | 6.63% |
| 2025 | $0.43 | 10.87% |
| 2024 | $0.39 | 13.69% |
| 2023 | $0.34 | 3.18% |
| 2022 | $0.33 | 13.75% |
| 2021 | $0.29 | 12.73% |
| 2020 | $0.26 | 6.30% |
| 2019 | $0.24 | -78.99% |
| 2018 | $1.16 | 5.20% |
| 2017 | $1.11 | 21.29% |
| 2016 | $0.91 | 39.95% |
| 2015 | $0.65 | 7.04% |
| 2014 | $0.61 | 4.66% |
| 2013 | $0.58 | 10.25% |
| 2012 | $0.53 | 15.95% |
| 2011 | $0.46 | 2.15% |
| 2010 | $0.45 | 222.74% |
| 2009 | $0.14 | -76.72% |
| 2008 | $0.59 | 28.53% |
| 2007 | $0.46 | 3.78% |
| 2006 | $0.44 | 0.00% |
EPS für ähnliche Unternehmen oder Wettbewerber
| Unternehmen | EPS | EPS-Differenz | Land |
|---|---|---|---|
| $3.76 | 719.76% |
CH
|
|
| - | - |
FR
|
|
| - | - |
JP
|
|
| - | - |
BR
|
|
| $-2.86 | -723.77% |
US
|


