


HMM Co.,Ltd
011200
Rang in Aktien
#1450
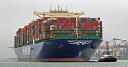
As a global, integrated logistics provider, HMM Co.,Ltd delivers comprehensive... As a global, integrated logistics provider, HMM Co.,Ltd delivers comprehensive shipping and freight forwarding solutions worldwide. The company facilitates the transport of a broad spectrum of goods, from vital bulk commodities like crude oil, coal, and iron ore, to specialized cargo and general import/export consignments. Its diverse fleet includes container ships, bulk carriers, various tankers (for crude oil and refined products), and trampers of different classes, such as Cape, Panamax, Supramax, and Handy vessels, alongside specialized heavy-lift and custom product carriers. Established in 1976, the company, originally known as Hyundai Merchant Marine Co.,Ltd, rebranded to HMM Co.,Ltd in March 2020. Its headquarters are situated in Seoul, South Korea.
Aktienkurs
$16.15
Marktkapitalisierung
$15.23B
Veränderung (1 Tag)
-0.43%
Veränderung (1 Jahr)
14.44%
Land
KR
Handel HMM Co.,Ltd (011200)


Kategorie
Industrials
Gewinn für HMM Co.,Ltd (011200)
Gewinn im Jun 2026 TTM: $1.07B
Laut den aktuellen Finanzberichten von HMM Co.,Ltd betragen die aktuellen Gewinne des Unternehmens $1.07B. Im Jahr 2023 erzielte das Unternehmen einen Gewinn von $814.40M, ein Rückgang im Vergleich zu dem Gewinn im Jahr 2022, der $8.07B betrug. Die auf dieser Seite angezeigten Gewinne sind die Gewinne vor Zinsen und Steuern, auch bekannt als EBIT.
Gewinnverlauf von HMM Co.,Ltd von 2007 bis 2026
Gewinn am Ende jedes Jahres
| Jahr | Gewinn | ändert |
|---|---|---|
| 2026 (TTM) | $1.07B | -59.51% |
| 2024 | $2.65B | 225.44% |
| 2023 | $814.40M | -89.91% |
| 2022 | $8.07B | 80.10% |
| 2021 | $4.48B | 3,706.68% |
| 2020 | $117.71M | -123.17% |
| 2019 | $-508.09M | -27.36% |
| 2018 | $-699.50M | -37.20% |
| 2017 | $-1.11B | 223.24% |
| 2016 | $-344.56M | -40.82% |
| 2015 | $-582.24M | 36.98% |
| 2014 | $-425.05M | -35.10% |
| 2013 | $-654.96M | -28.07% |
| 2012 | $-910.56M | 106.88% |
| 2011 | $-440.15M | -243.02% |
| 2010 | $307.75M | -143.07% |
| 2009 | $-714.52M | -253.73% |
| 2008 | $464.79M | 96.74% |
| 2007 | $236.24M | 0.00% |
Gewinn ähnlicher Unternehmen oder Konkurrenten
| Unternehmen | Gewinn | Gewinnunterschied | Land |
|---|---|---|---|
| - | - |
KR
|
|
| - | - |
DK
|
|
| $1.69B | 57.41% |
IN
|
|
| - | - |
CN
|
|
| - | - |
DE
|


