


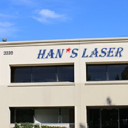
Han's Laser Technology Industry Group Co., Ltd.
002008
Rang in Aktien
#2145
Han's Laser Technology Industry Group Co., Ltd. is a prominent entity in the... Han's Laser Technology Industry Group Co., Ltd. is a prominent entity in the People's Republic of China, specializing in the development, manufacturing, and distribution of advanced laser processing and industrial automation equipment. Its extensive product portfolio encompasses a wide array of laser systems, including those for engraving, marking, etching, welding, and cutting. Beyond core laser technologies, the company also provides 3D printers, comprehensive automation solutions, plasma cleaning machines, CNC equipment, and industrial robots. These sophisticated tools find their primary application across a broad spectrum of industries, notably electronics and semiconductors, mechanical hardware, new energy, packaging, materials processing, automotive, and sheet metal fabrication. Complementing its product offerings, the group delivers essential machine installation and ongoing after-sales services. Established in 1996, the firm was initially known as Han's Laser Technology Co., Ltd. before officially changing its name to Han's Laser Technology Industry Group Co., Ltd. in November 2014. It is headquartered in Shenzhen, People's Republic of China.
Aktienkurs
$9.07
Marktkapitalisierung
$9.33B
Veränderung (1 Tag)
-5.55%
Veränderung (1 Jahr)
75.89%
Land
CN
Handel Han's Laser Technology Industry Group Co., Ltd. (002008)


Kategorie
Industrials
Kursverlauf für Han's Laser Technology Industry Group Co., Ltd. (002008)
Höchster Schlusskurs: $9.83 am 2026-10-01
Niedrigster Schlusskurs: $0.37 am 2004-06-01
Niedrigster Schlusskurs: $0.37 am 2004-06-01
Kursverlauf der Aktie von Han's Laser Technology Industry Group Co., Ltd. von 2004 bis 2026
Jährliche Kursentwicklung
| Jahr | Leistung |
|---|---|
| 2026 (TTM) | 108.89% |
| 2025 | 52.54% |
| 2024 | 24.20% |
| 2023 | -23.89% |
| 2022 | -52.02% |
| 2021 | 31.60% |
| 2020 | 10.94% |
| 2019 | 18.60% |
| 2018 | -41.68% |
| 2017 | 144.25% |
| 2016 | -19.09% |
| 2015 | 46.04% |
| 2014 | 28.81% |
| 2013 | 67.96% |
| 2012 | 10.19% |
| 2011 | -39.60% |
| 2010 | 105.30% |
| 2009 | 52.72% |
| 2008 | -62.74% |
| 2007 | 154.33% |
| 2006 | 159.09% |
| 2005 | 13.24% |
| 2004 | 0.00% |
Aktienkurs vergleichbarer Unternehmen oder Wettbewerber
| Unternehmen | Aktienkurs | Veränderung 1J% | Land |
|---|---|---|---|
| $237.63 | 70.50% |
US
|
|
| $287.21 | 2.20% |
DE
|
|
| $262.22 | -8.41% |
FR
|
|
| $138.02 | 24.06% |
DE
|
|
| $888.34 | 19.82% |
US
|


